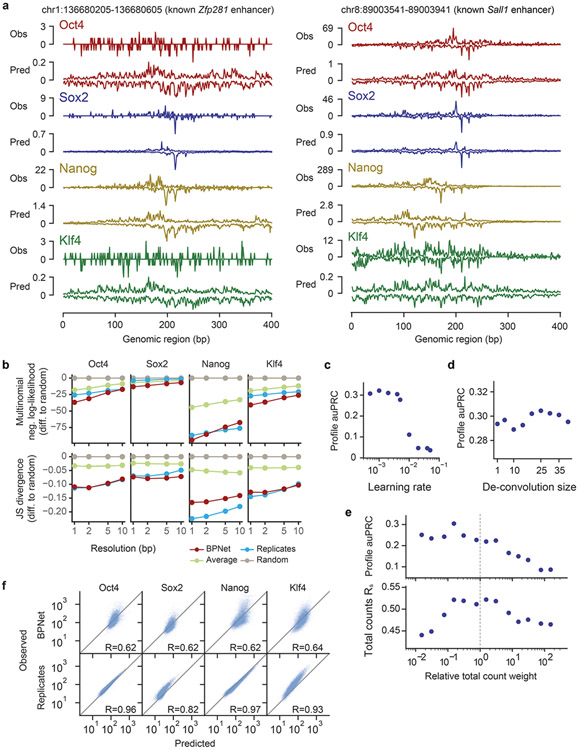
Extended Data Fig. 1. Additional performance evaluation of BPNet’s predictions of ChIP-nexus data.
a) Observed and predicted ChIP-nexus read counts mapping to the forward strand (dark) and the reverse strand (light) for the Zfp281 and Sall1 enhancers located on the held-out (test) chromosome 1. b) Alternative profile shape evaluation metrics showing the difference to random predictions: multinomial negative log-likelihood and Jensen-Shannon (JS) divergence. Both metrics were computed at different resolutions (from 1 bp to 10 bp windows) in held-out test chromosomes 1, 8 and 9. c) auPRC of profile predictions is high across various learning rates on the tuning set chromosomes 2, 3 and 4, demonstrating the robustness of the model. d) The deconvolutional layer slightly improves the profile predictive performance compared to a point-wise convolutional layer (deconvolution size=1). e) auPRC of profile predictions (top) and the Spearman correlation of total count predictions (bottom) for a range of different relative total count weight α in the BPNet loss function parameterized as λ = α/2 n_obs. Relative weight of 1 (center) denotes equal weighting of the counts and profile loss functions. The best performance is obtained for α < 1, showing that putting more weight to profile predictions aids both profile and count predictions. f) Observed and predicted total read counts for BPNet (top) and replicate experiments (bottom) across the four studied TFs along with the Spearman correlation coefficient.

