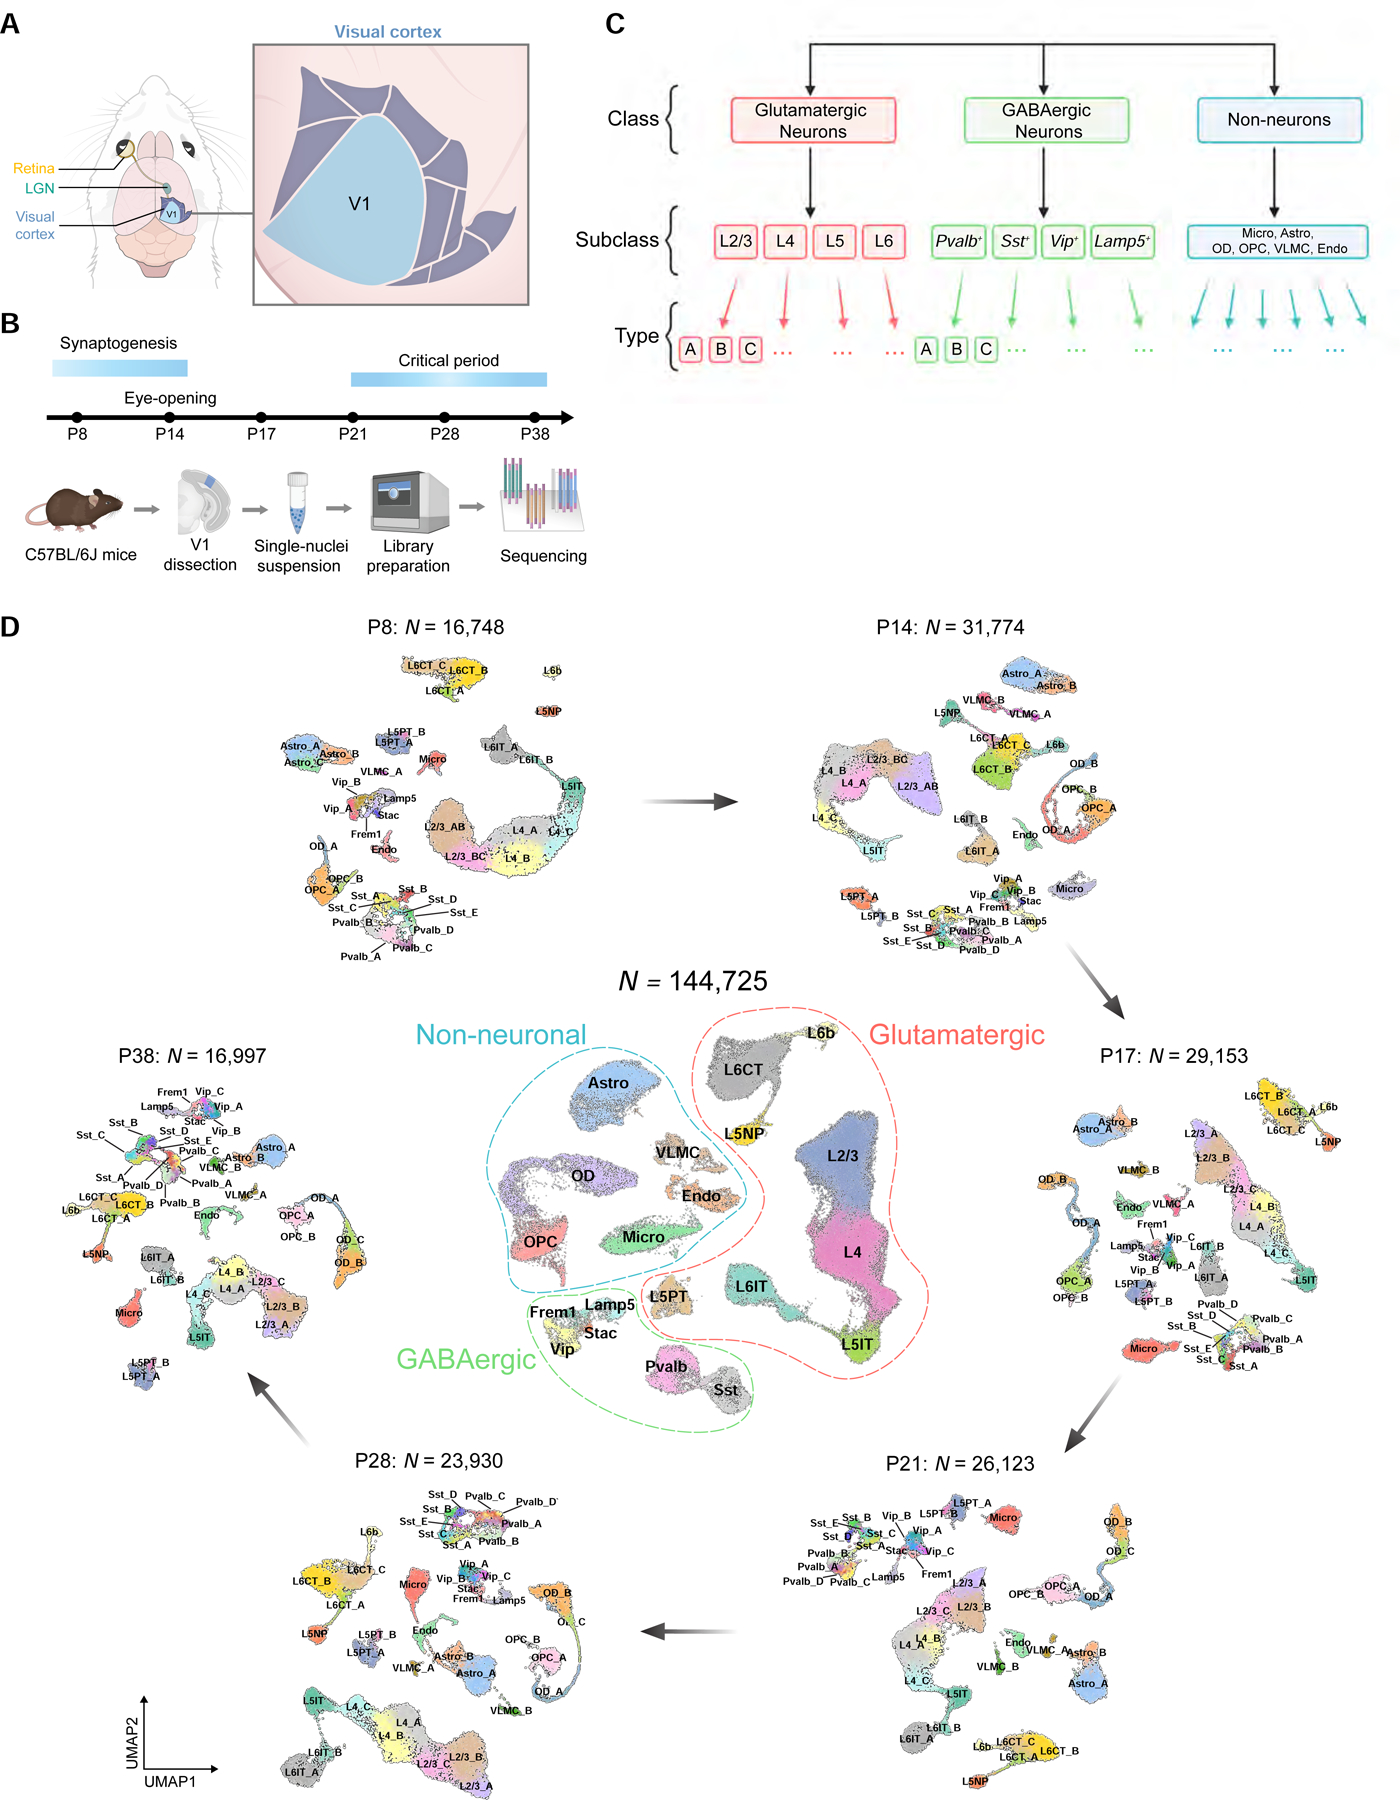
Figure 1. snRNA-seq profiling of V1 during postnatal development.

A. Schematic of the mouse visual system. Primary visual cortex (V1). Surrounding higher visual areas: A, anterior; AL, anterolateral; AM, anteromedial; LI, laterointermediate; LM, lateromedial; P, posterior; PM, posteromedial; POR, postrhinal; RL, rostrolateral; TEA, temporal anterior areas.
B. Experimental workflow of snRNA-seq profiling of V1 at six postnatal ages.
C. Cellular taxonomy of V1.
D. UMAP visualization of V1 transcriptomic diversity during postnatal development. Dots correspond to cells and distances between them reflect degrees of transcriptomic similarity. Central panel shows cells from all six ages colored by subclass identity (Table S1). Peripheral panels show cells from different ages, colored by type identity determined via clustering. Data from each age and class were analyzed separately and then merged for visualization purposes.
