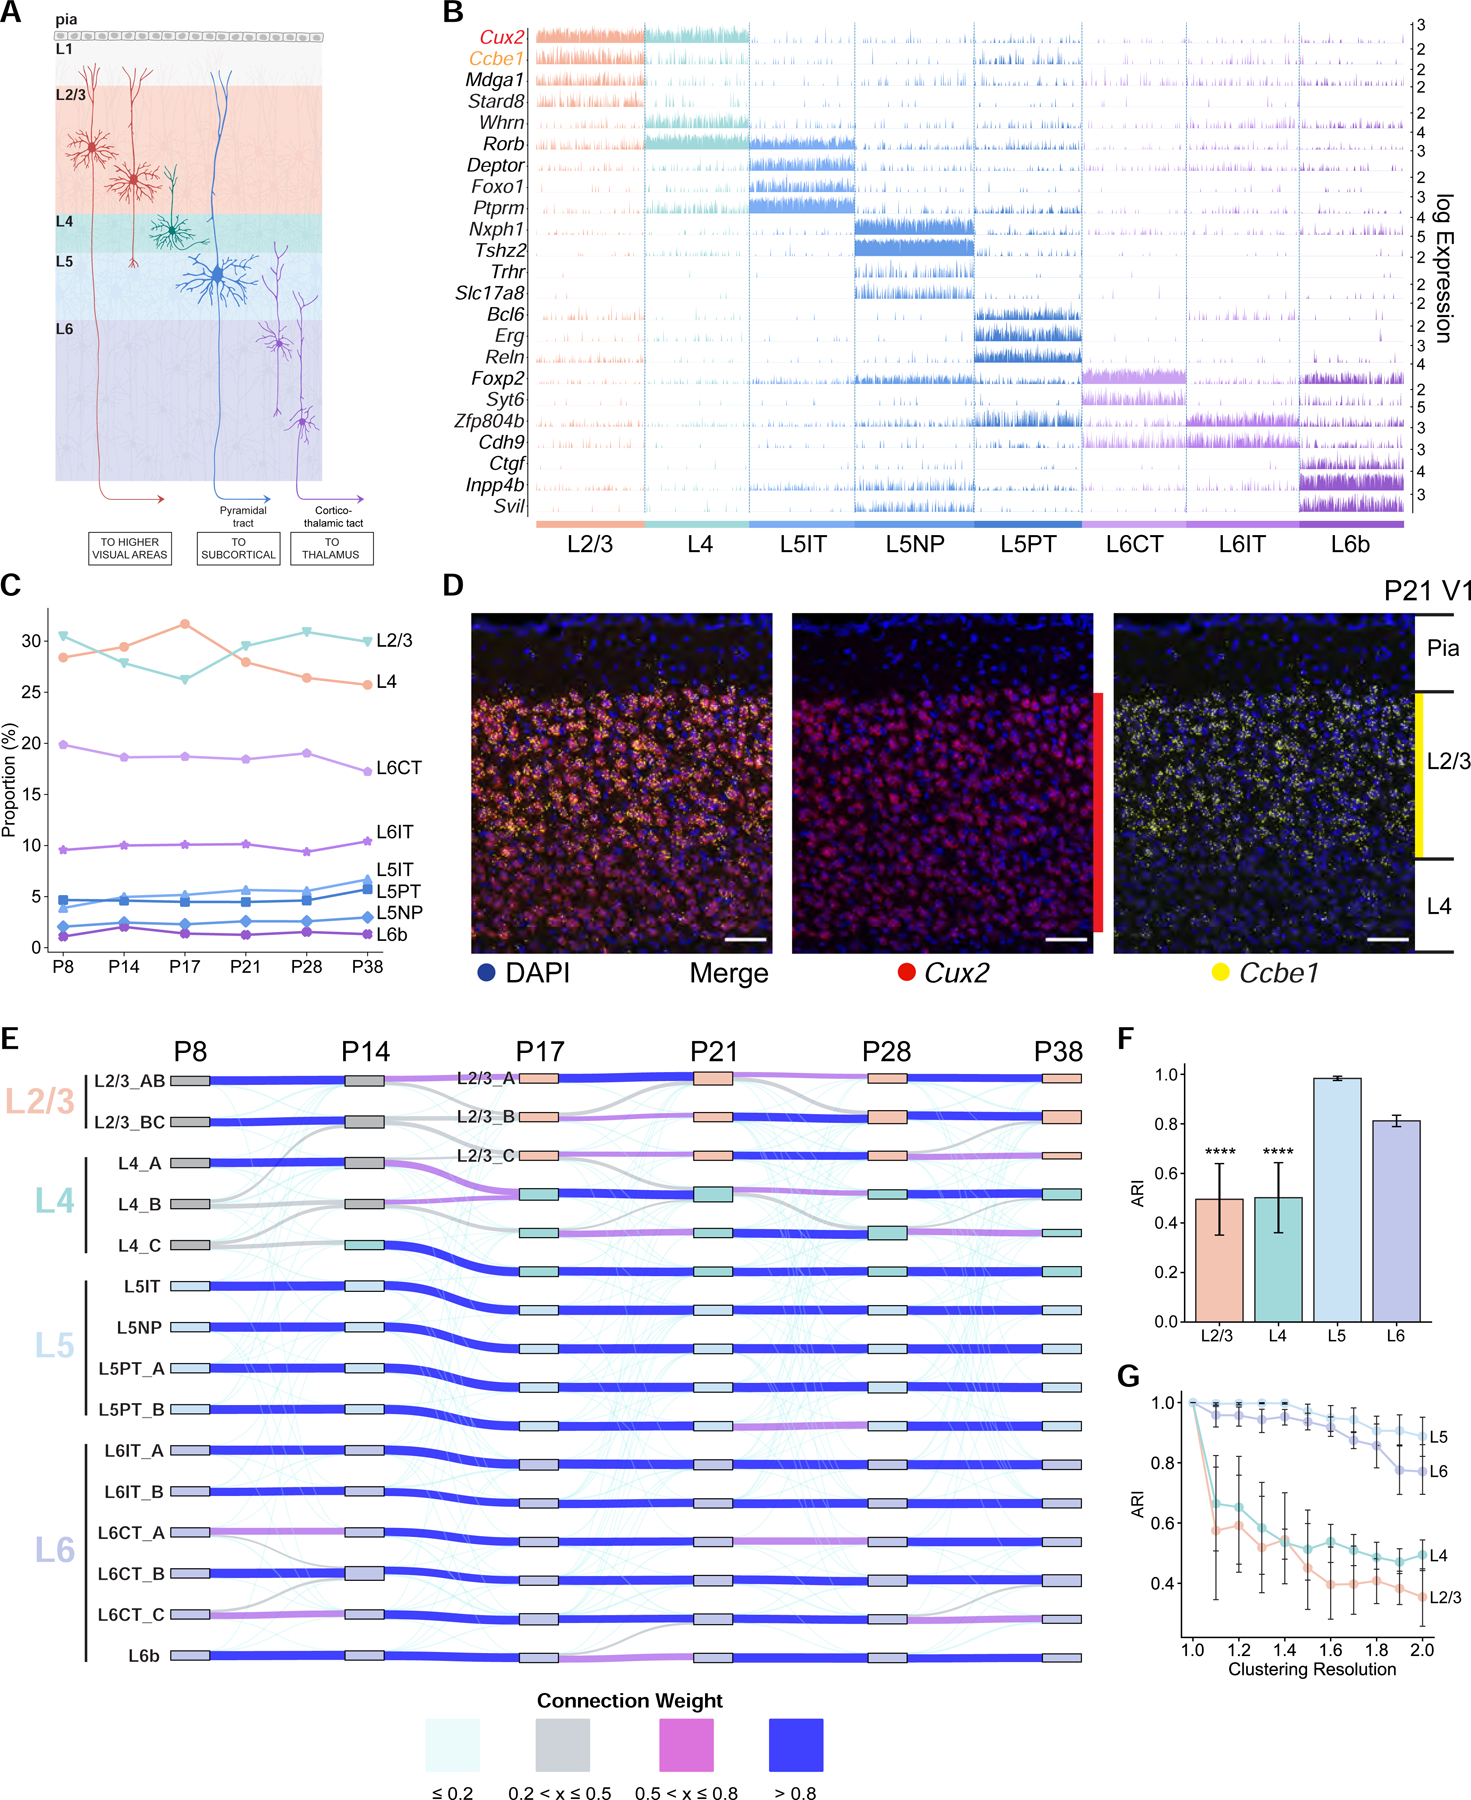
Figure 2. Transcriptomic diversity of V1 glutamatergic neurons during postnatal development.

A. Schematic of glutamatergic neurons in V1 arranged in layers L1-L6.
B. Tracks plot showing subclass-specific markers (rows) in glutamatergic neurons (columns), grouped by subclass (e.g., L2/3). 1000 randomly selected cells from each subclass were used for plotting. Scale on the y-axis (right), normalized, log-transformed transcript counts in each cell. Ccbe1, a L2/3 marker, and Cux2, a L2/3/4 marker, are highlighted.
C. The proportions of glutamatergic subclasses are stable with age despite significant variation in the number of cells profiled (Table S2).
D. Coronal section through V1 analyzed by fluorescent in situ hybridization (FISH) at P21. Ccbe1 is selective for L2/3 glutamatergic neurons. Cux2 is expressed in L2/3 and L4 glutamatergic neurons and in inhibitory neurons and non-neuronal cells (see Figure S2B for other ages). Scale, 50 μm.
E. Transcriptomic similarity identifies temporal associations among V1 glutamatergic neuron types across ages. Sankey diagram computed using a supervised classification approach. Nodes, individual V1 glutamatergic neuron types at each age (as in Figure 1D); edges, colored based on transcriptomic correspondence.
F. Adjusted Rand Index (ARI) values quantifying temporal correspondence of glutamatergic types between each pair of consecutive ages based on transcriptomic similarity. Individual bars denote layers. ARI ranges from 0 (no correspondence) to 1 (perfect correspondence). Bar heights, mean ARI computed across pairs of consecutive ages; error bars, standard deviation; ***, P<0.0001 (one-way ANOVA) for L2/3 and L4 against L5 and L6.
G. Types in L2/3 and L4, but not L5 and L6, are sensitive to changes in clustering resolution. Glutamatergic neurons at each age are re-clustered at different values of the resolution parameter (x-axis), and the results are compared with the base case corresponding to resolution = 1 (STAR Methods). Line plots, mean ARI values for each layer (colors); error bars, standard deviation across ages.
