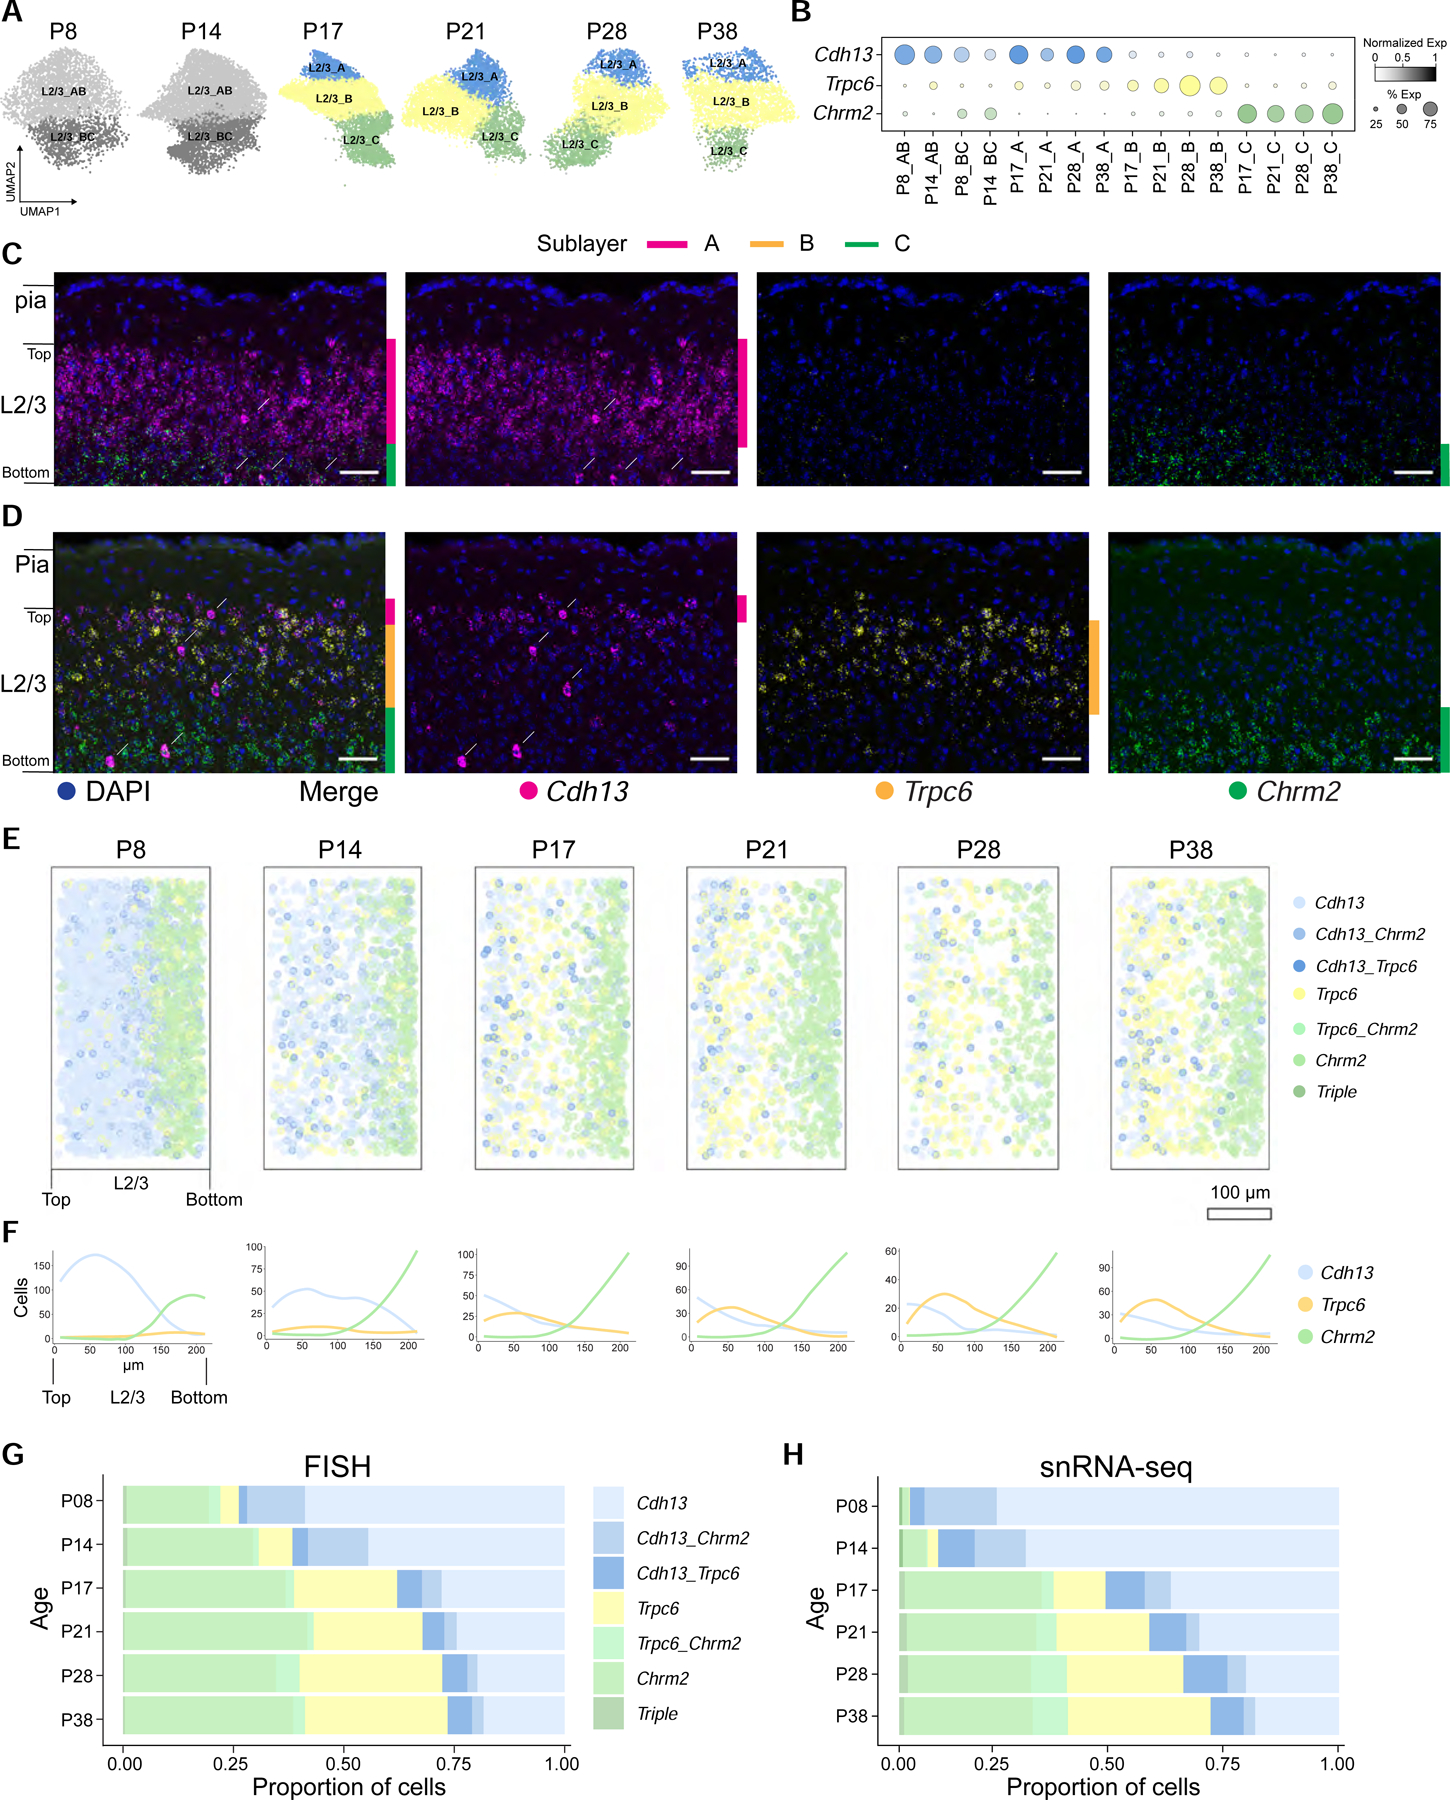
Figure 3. Anatomical and transcriptomic maturation of L2/3 glutamatergic neuron types.

A. UMAP plots of L2/3 glutamatergic neuron types across ages.
B. Dot plot showing expression patterns of L2/3 type-specific genes (rows and colors) across L2/3 neuron types arranged by age (columns).
C. FISH images showing type markers Cdh13, Trpc6, and Chrm2 within L2/3 at P8. Vertical colored bars, sublayers expressing the indicated markers; arrows, large cells expressing Cdh13 are not excitatory neurons; they are a subset of inhibitory and non-neuronal cells. Scale, 50 μm.
D. Same as C, at P38.
E. Pseudo-colored representation of Cdh13, Trpc6, and Chrm2 expression in L2/3 cells at six ages. Cells are colored based on expression levels of one or more of these markers. Each panel is an overlay of five or six images of V1 from three mice. Pial to ventricular axis is oriented horizontally from left to right within each panel. Total number of cells analyzed: P8, 2324; P14, 1142; P17, 1036; P21, 1038; P28, 653; and P38, 1034. Scale bar, 100 μm. Panels E and F are rotated relative to Panels C and D. “Top” and “Bottom” are indicated.
F. Line tracings quantifying the number of cells per bin at each position along the pial to ventricular axis corresponding to panel E. 0 on the x-axis, region of L2/3 closest to pia. 14 bins were used over the depth of L2/3.
G. Relative proportions of cells within each expression group defined in panel E quantified using FISH data.
H. Same as G using snRNA-seq data.
