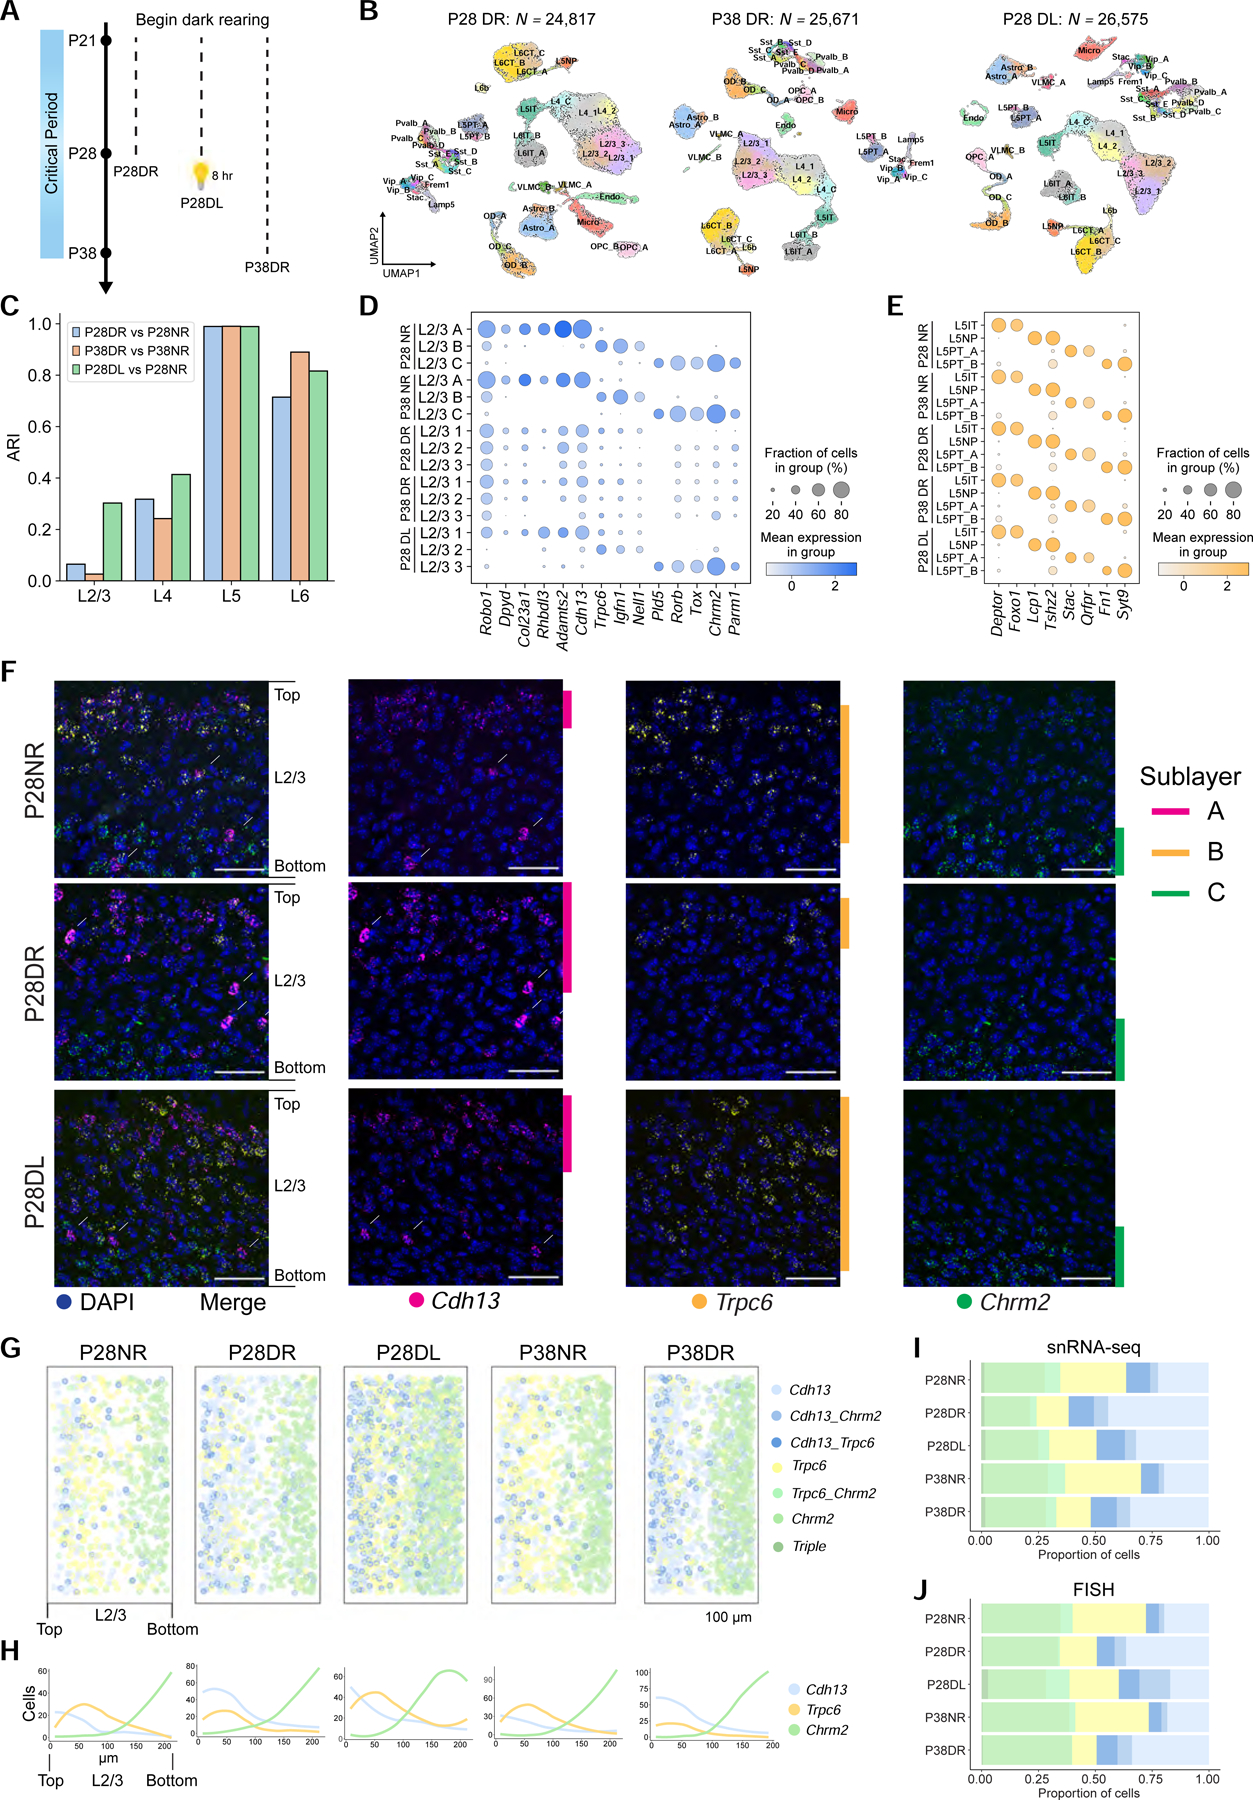
Figure 4. Visual experience is required to maintain L2/3 glutamatergic neuron types.

A. Schematic of experiments. Data collected from three rearing conditions: Dark-reared between P21-P28 (P28DR) and P21-P38 (P38DR), and dark-reared between P21-P28 followed by 8 hrs (P28DL).
B. UMAP plots of transcriptomic diversity in P28DR, P38DR, and P28DL. Clusters that match 1:1 to normally-reared (NR) types in Figure 1D are labeled. This was not possible for all L2/3 and two L4 clusters, which correspond poorly to NR types. We therefore provisionally labeled these clusters L2/3_1, L2/3_2, L2/3_3, L4_1, and L4_2.
C. Adjusted Rand Index (ARI) quantifying transcriptomic similarity within each layer (x-axis) between glutamatergic clusters observed in dark-reared mice and types observed in normally-reared (NR) mice. Colors correspond to comparisons as indicated.
D. Expression of L2/3 type markers (columns) in NR, DR, and DL types and clusters (rows) at P28 and P38.
E. Same as panel D for L5. DR and DL clusters are labeled based on their tight transcriptomic correspondence with NR types (Figure S5F, G).
F. FISH images showing expression of L2/3 markers in NR, DR, and DL at P28. Arrows, inhibitory neurons expressing Cdh13. The level of Cdh13 is modestly repressed by vision. Scale, 50 μm.
G. Pseudo-colored representation of Cdh13, Trpc6, and Chrm2 expression in NR, DR, and DL mice at P28 and P38. Each plot is an overlay of 5–6 images of V1 from three mice. Pial to ventricular axis is oriented horizontally from left to right within each panel. Total number of cells analyzed: P28NR, 653; P28DR, 989; P28DL, 1732; P38NR, 1034; and P38DR, 1177).
H. Cells per bin at each position along the pial to ventricular axis corresponding to panel G. 0 on the x-axis, region of L2/3 closest to pia. 14 bins were used over the depth of L2/3.
I. Proportions of L2/3 cells within each expression group defined in panel G quantified using snRNA-seq data
J. Same as I using FISH data.
