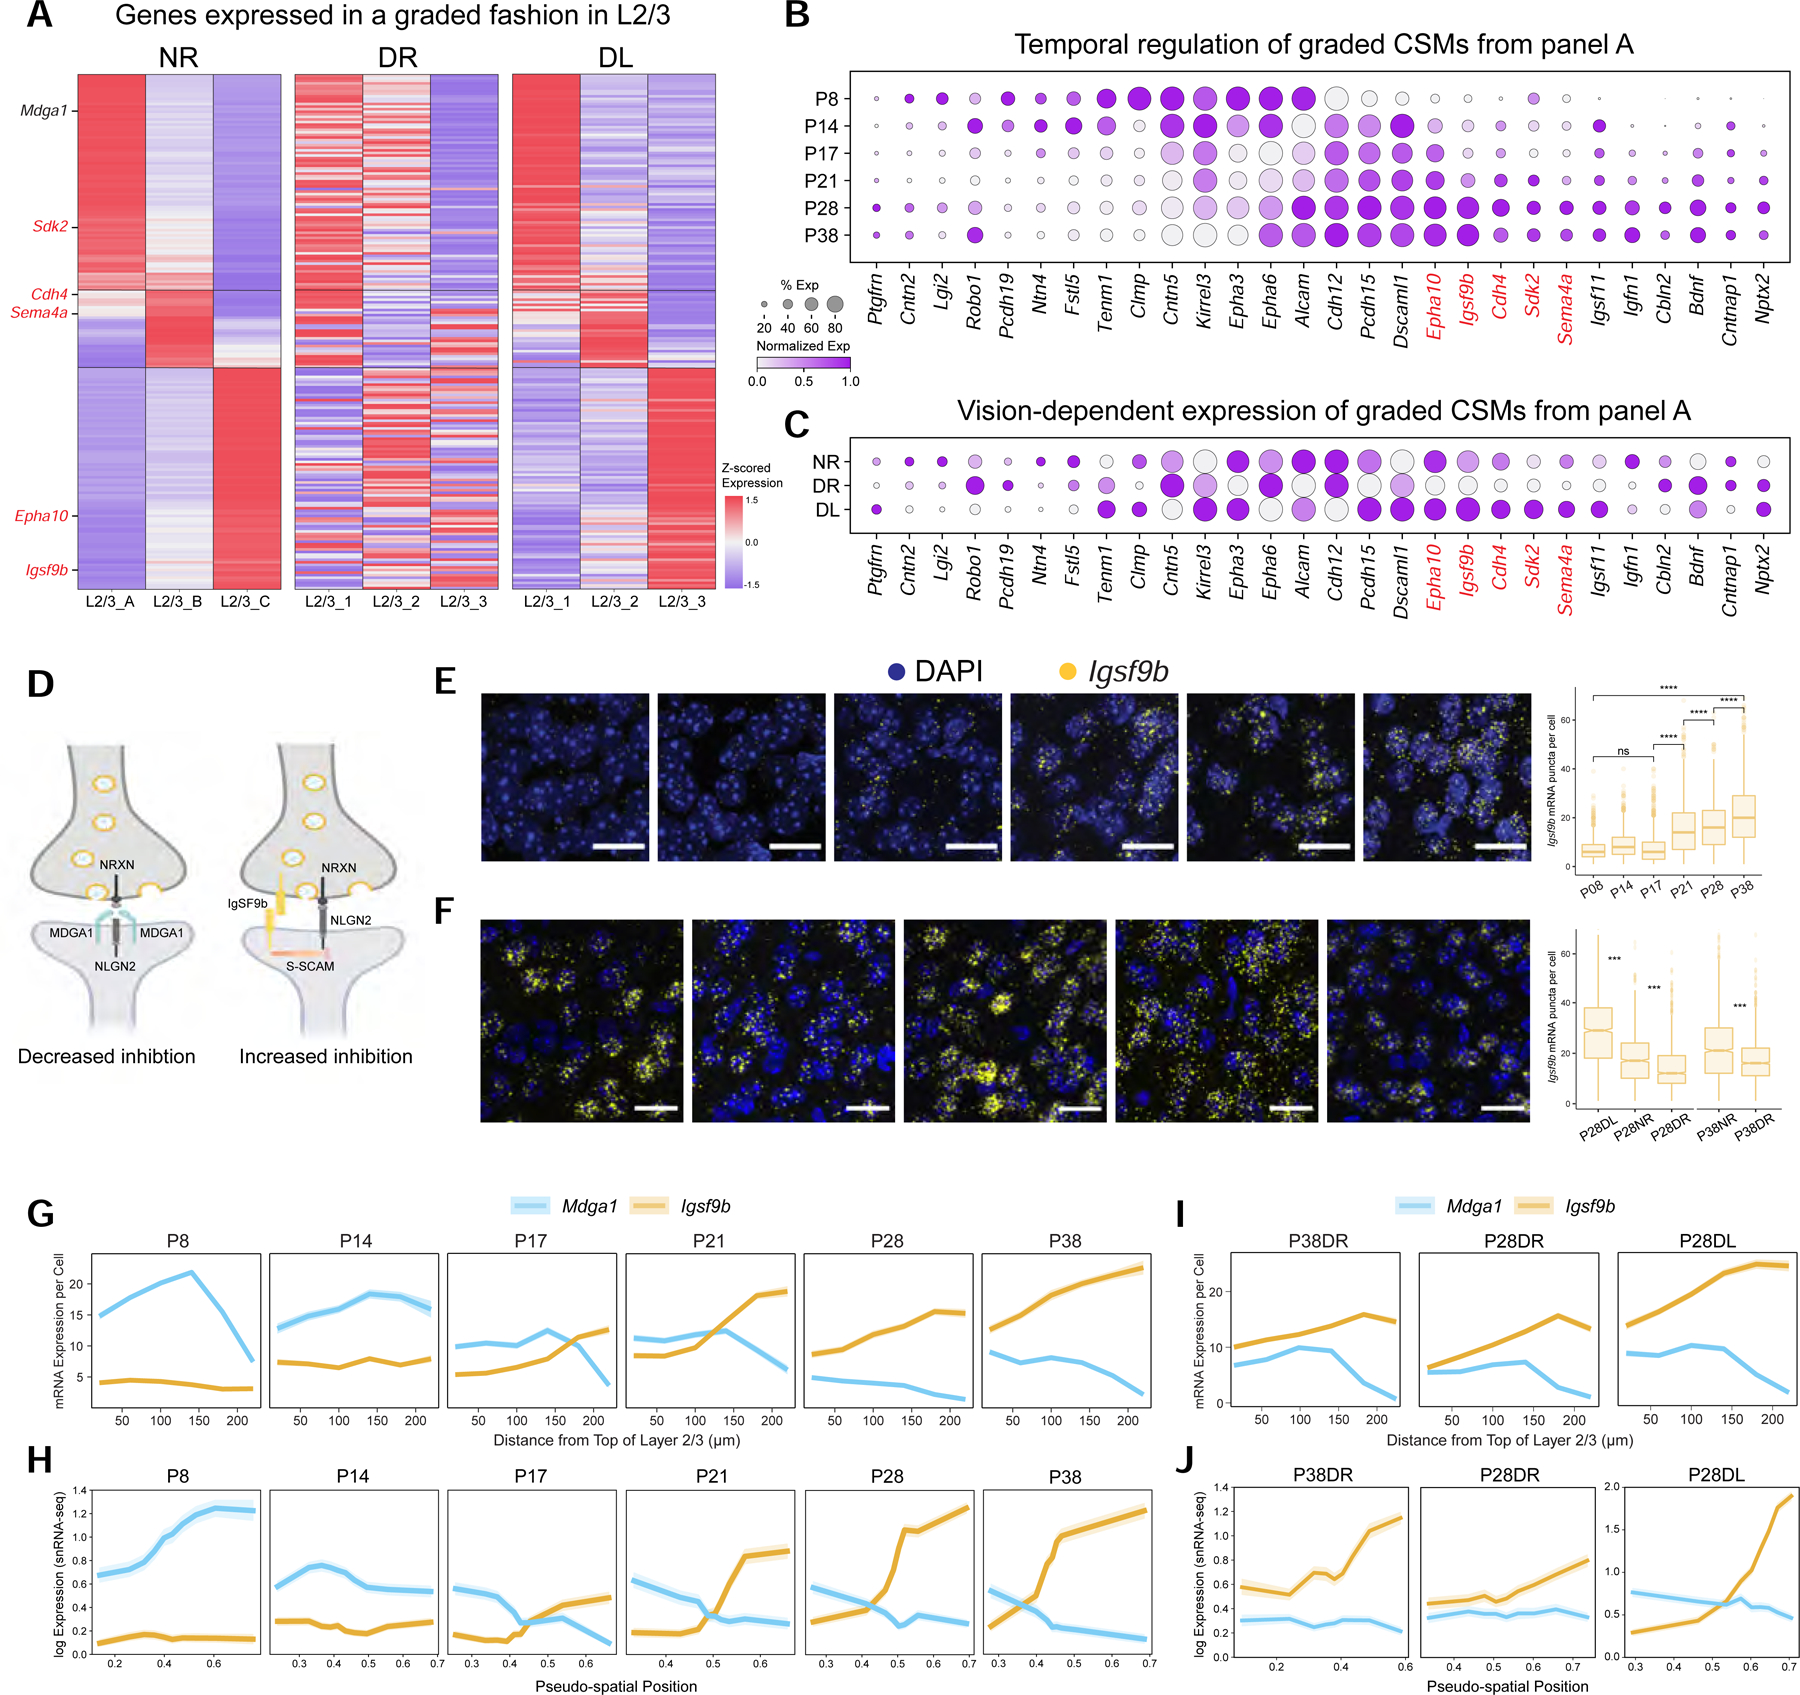
Figure 6. Continuous variation of L2/3 neuron types and vision-dependent gene gradients implicated in wiring.

A. Heatmap of L2/3 type-specific genes with graded expression in normally-reared mice (NR). This is disrupted in dark-reared mice (DR) and partially recovered by exposing DR mice to light for 8 hrs (DL). For the full set of L2/3 type-specific genes grouped by expression pattern, see Figure S6A. Genes satisfying criteria in panels B and C (see text) are indicated in red lettering. Two of the three L4 cell types also exhibit graded expression differences (see Figure S6L–M).
B. Temporal regulation of cell surface molecules (CSMs) in panel A. Red print, genes upregulated during the classical critical period (P21-P38), downregulated in DR, and upregulated in DL.
C. Same illustration as panel B across the conditions P28NR, P28DR, and P28DL.
D. Schematic of MDGA1 and IGSF9B interactions with NLGN2 at synapses. MDGA1 prevents NLGN2 interaction with NRXN presynaptically. IGSF9B binds homophilically and interacts with S-SCAM postsynaptically as does NLGN2.
E. FISH images of Igsf9b mRNA over time in V1. Three animals per time point, six images per animal. Scale, 20 μm. (Right) Box plot quantifying expression. Wilcoxon Rank Sum Test, **** P <0.0001. Cells quantified: P8,1191; P14,1011; P17, 1389; P21, 1729; P28, 1277; and P38, 1588.
F. FISH images showing that dark rearing decreases Igsf9b expression in L2/3, and eight hours of light restores expression. Scale, 50 μm. (Right) Box plot quantifying expression. Three animals imaged per age and condition combination. Cells quantified: P28NR, 1290 cells; P28DL, 1506 cells; P28DR, 1521 cells; P38NR, 1629 cells; and P38DR, 1885. Quantified at 40X. Wilcoxon Rank Sum Test, *** P <0.001.
G. FISH quantification of average Mdga1 and Igsf9b expression (y-axis) in glutamatergic cells as a function of distance from the top of L2/3 (x-axis). Shaded ribbons represent standard error of the mean. Cells quantified: P8, 2204; P14, 928; P17, 1037; P21, 1183; P28, 719; and P38, 942. Data from three or four animals at each age.
H. Reconstruction of Mdga1 and Igsf9b expression levels averaged across cells based on their inferred L2/3 pseudo-spatial locations in gene expression space (see STAR Methods). Shaded ribbons, standard deviation.
I. Same as panel G for P38DR, P28DR, and P28DL. Cell numbers: P38DR, 719; P28DR, 1061; and P28DL, 1053 cells. Data collected from three animals at each time point
J. Same as panel H for P38DR, P28DR, and P28DL. Note difference in scale for P28DL to capture the extent of increase in Igfs9b expression.
