. 2022 Jan 24;11:e74387. doi: 10.7554/eLife.74387

Figure 1. Heterogenous morphology of clathrin-coated structures in dendrites.

(A) Example image of neuron expressing Homer1c-mCherry and GFP-CLCa. Scale bar: 20 µm. (B) Comparison of confocal and gSTED images of dendrite expressing Homer1c-mCherry and GFP-CLCa. Scale bars dendrite: 2 µm, zooms: 500 nm. (C) Number of CCSs per PSD per neuron, represented as mean ± SEM (N = 12 neurons). (D) Scatterplot of the length (µm) and width (µm) of CCSs in the dendritic shaft and associated with Homer1c based on ferret dimensions (spine: n = 248, shaft: n = 301). (E) Circularity ratio plotted against area (µm2) (spine: n = 248, shaft: n = 301).

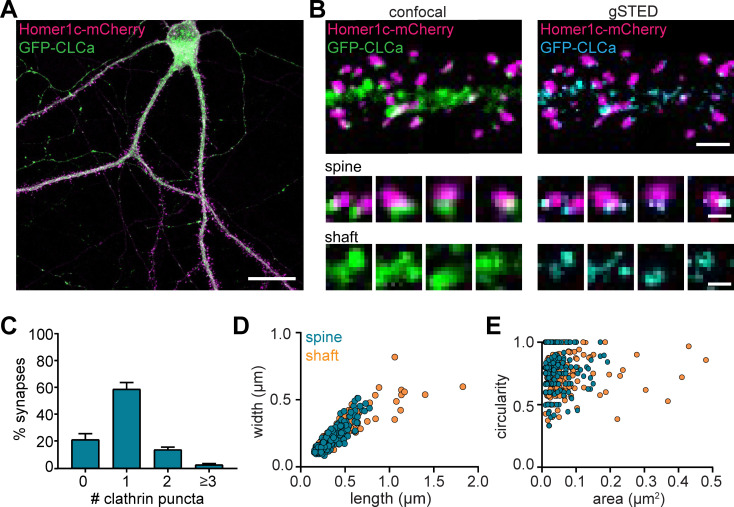
Figure 1—source data 1. Excel sheet with numerical data represented as plots in Figure 1C, D and E.

Figure 1.

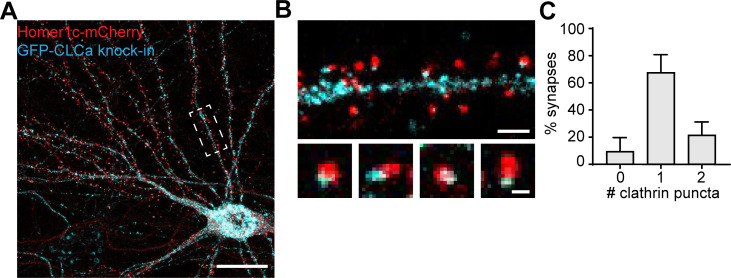
Figure 1—figure supplement 1. Distribution of endogenously tagged CLCa in neurons.

Figure 1—figure supplement 1.

(A) Example image of neuron expressing Homer1c-mCherry and GFP-CLCa knock-in construct. Scale bar: 20 µm. (B) Example image of CCSs in the dendrite (upper panel) and zooms of individual synapses associated with an EZ (lower panel). Scale bars: 2 µm, zooms: 500 nm. (C) Quantification of the average number of CCSs per synapse, plotted as mean ± SEM (n = 6).
Figure 1—figure supplement 1—source data 1. Excel sheet with numerical data represented as plot in Figure 1—figure supplement 1C.