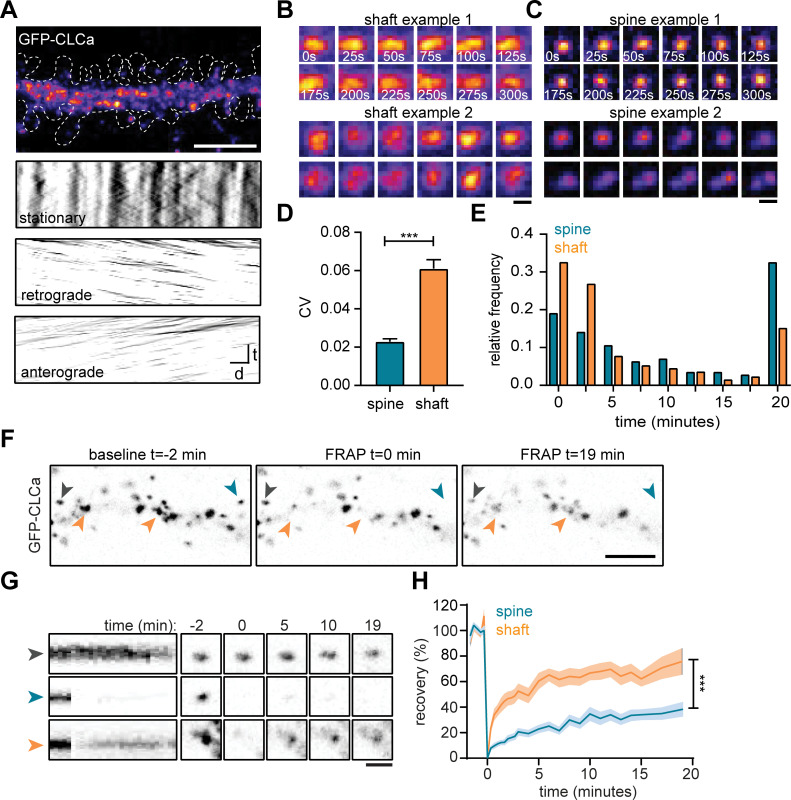
Figure 2. The EZ is dynamically distinct from shaft CCSs.
(A) Representative dendrite expressing GFP-CLCa, scale bar: 5 µm, and kymographs of CCSs in the dendritic shaft only, separated in stationary (upper panel), retrograde (middle panel) and anterograde (lower panel) particles. Scale: time t, on the y-axis is 5 min, and distance d on x-axis is 20 µm. (B) Two examples of intensity fluctuations in stationary dendritic shaft structures. Scale bar: 1 µm. (C) Two examples of intensity fluctuations in spine structures. Scale bar: 1 µm. (D) Fluctuations in intensity plotted as the coefficient of variance (CV) between shaft and spine (spine: n = 48, shaft: n = 49, p < 0.001). Data represented at mean ± SEM. (E) Histogram of the lifetime of CCSs in shaft and spine (spine: n = 171, shaft n = 769), data represented as fraction. (F) Example images of GFP-CLCa before (left panel), directly after FRAP (middle panel) and recovery (right panel), scale bar: 5 µm. Gray arrow indicates control, unbleached region, blue indicated bleached EZ, orange indicates bleached stationary dendritic shaft structures. (G) Kymograph and example images of the structures indicated in F. Kymograph shows 22-min acquisition, scale bar: 1 µm. (H) Percentage of recovery in shaft (orange, n = 14) and spine (blue, n = 30).

