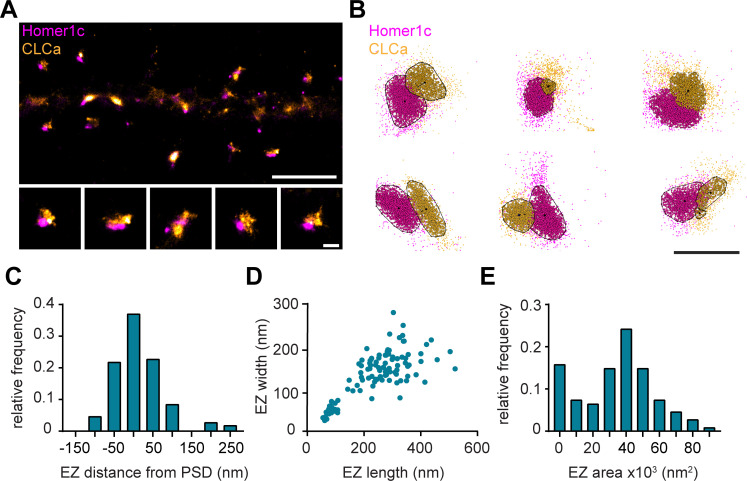
Figure 3. Nanoscale organization of the postsynaptic endocytic zone.
(A) SMLM image of dendrite expressing Homer1c-mCherry and GFP-CLCa labeled with CF568 and A647 and zooms of individual EZs, respectively. Scale bar upper panel: 2 µm, zooms: 250 nm. (B) Individual molecules of Homer1c (magenta) and CLCa (orange) are outlined using DBScan. Black dot and line indicate center of the EZ (dot) and distance to the border of the PSD (line). Scale bar: 500 nm. (C) Histogram of the border (Homer1c) to center (CLCa) distance in nm. (D) Scatterplot of the FWTM length (nm) and FWTM width (nm) of the EZ. (E) Histogram of the area of the EZ plotted as x103 nm2. (C–E) n = 107.


