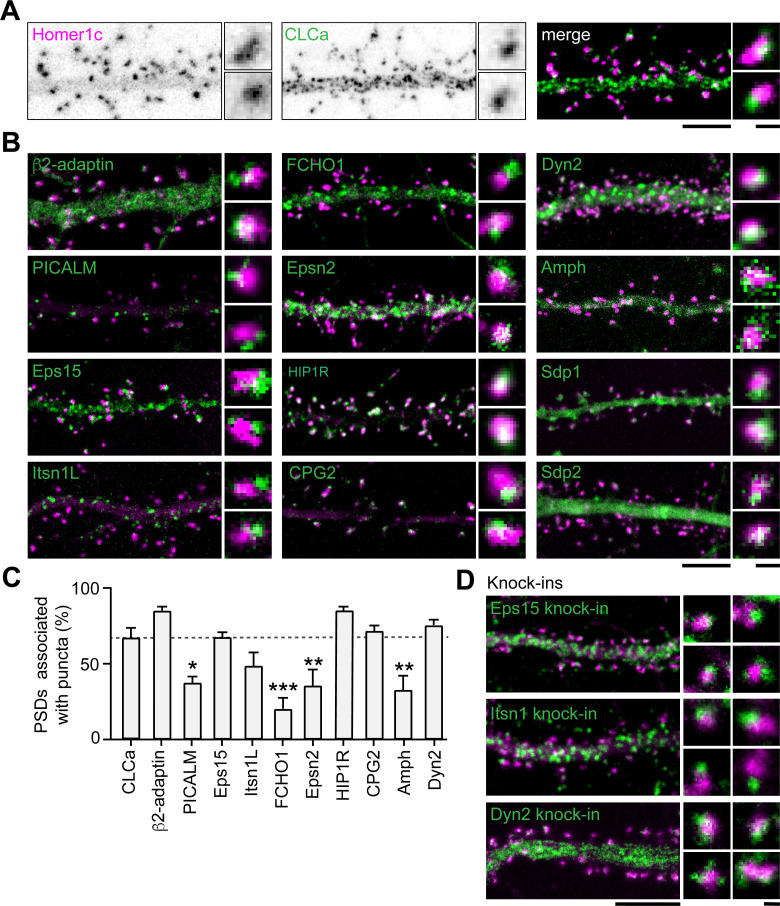
Figure 4. Endocytic accessory proteins are associated with the PSD.
(A) Example images of dendrites expressing Homer1c-mCherry to mark PSDs and GFP-CLCa visualized as black and white images (left, middle panel), and merge (right panel). (B) Example images of neurons co-expressing tagged endocytic proteins relative to Homer1c. (A–B) Scale bars: 5 µm, zoom dimensions: 1 µm. (C) Percentage of synapses associated with endocytic proteins, represented as mean ± SEM. Relative to Homer1c-CLCa association (N = 8), PICALM-mCherry (N = 6, p < 0.05), FCHO1-mCherry (N = 6, p < 0.001), Epsn2-mCherry (N = 9, p < 0.01), and Amph-mCherry (N = 6, p < 0.01) were significantly less often associated with the PSD, while β2-adaptin- GFP (N = 6), GFP-Eps15 (N = 5), GFP-Itsn1L (N = 5), HIP1R-GFP (N = 9), GFP-CPG2 (N = 5), Dyn2-GFP (N = 5) were not different from GFP-CLCa. (D) Example images of neurons expressing Homer1c-ALFA labeled with Cy3 (magenta) and endogenously GFP-tagged endocytic proteins using CRISPR/Cas9-mediated genome editing (green). Scale bar: 5 µm, zoom: 500 nm. Data represented as mean ± SEM.


