. 2022 Jan 24;11:e74387. doi: 10.7554/eLife.74387

Figure 5. Endocytic proteins are differentially associated with the PSD.

(A) Example image of FCHO1 (green) that is transiently associated with Homer1c (magenta). Zooms show temporal recruitment of FCHO1. Scale bar: 5 µm, zoom: 500 nm. (B) Example image of CPG2 that is stably associated with Homer1c. Zooms show temporal dynamics of CPG2. Scale bar: 5 µm, zoom: 500 nm. (C) Percentage of synapses that contain at least one stable structure (persisting for >9 min). Only PICALM-mCherry (N = 5, p < 0.01) was significantly less often stably associated with the PSD compared to GFP-CLCa (N = 6). β2-adaptin-GFP (N = 6), GFP-Eps15 (N = 6), GFP-Itsn1L (N = 6), FCHO1-mCherry (N = 5), Epsn2-mCherry (N = 5), HIP1R-GFP (N = 6), GFP-CPG2 (N = 8), Amph-mCherry (N = 5), Dyn2-GFP (N = 7), were not different from GFP-CLCa. (D) Heatmap visualizing the frequency distribution of the lifetime of endocytic proteins associated with the PSD. The histogram on top is an example of FCHO1 (orange) that is mostly short-lived, and CPG2 (blue) that is mostly stable, plotted as relative frequency. (E) Summary graph of the recovery 10 min after FRAP for GFP-Eps15 (n = 23, p < 0.001), GFP-Itsn1L (n = 20, p < 0.001), HIP1R-GFP (n = 44, p < 0.01), Dyn2-GFP (n = 51, p < 0.001) had significantly higher turnover compared to GFP-CLCa (n = 32). GFP-CPG2 (n = 22) and β2-adaptin GFP (n = 13) were not different compared to GFP-CLCa. Data plotted as mean ± SEM.

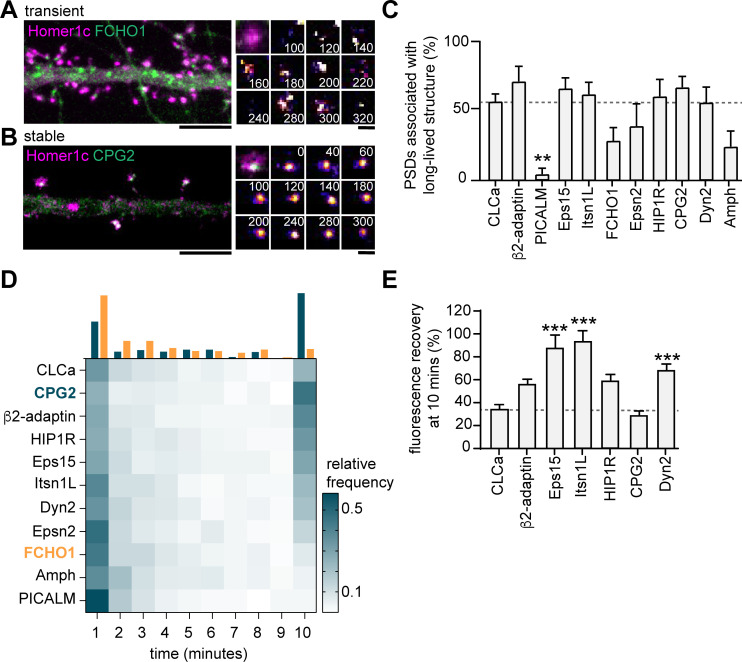
Figure 5—source data 1. Excel sheet with numerical data represented as plots in Figure 5C, D and E.

Figure 5.

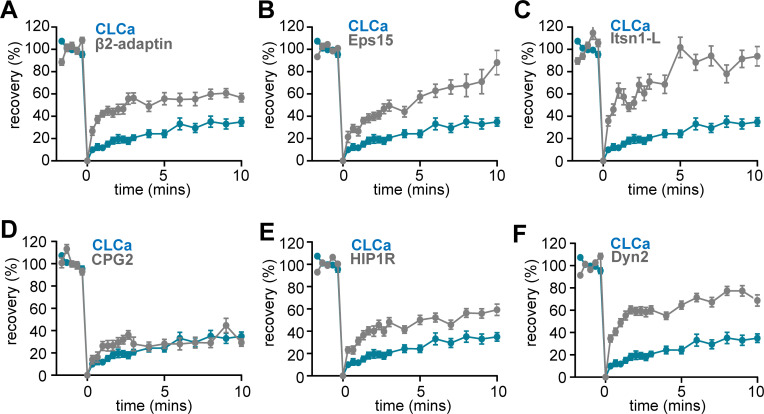
Figure 5—figure supplement 1. FRAP curves of endocytic proteins compared to CLCa.

Figure 5—figure supplement 1.

(A–F) FRAP curves of endocytic proteins (gray) and CLCa (blue) after bleaching on t = 0 for (A) β2-adaptin (n = 13), (B) Eps15 (n = 23), (C) Itsn1L (n = 20), (D) CPG2 (n = 22), (E) HIP1R (n = 44) and (F) Dyn2 (n = 51).
All graphs show the same CLCa (n = 32) data for comparison. All data is plotted as mean ± SEM.
Figure 5—figure supplement 1—source data 1. Excel sheet with numerical data represented as plots in Figure 5—figure supplement 1A,B,C,D,E,F.
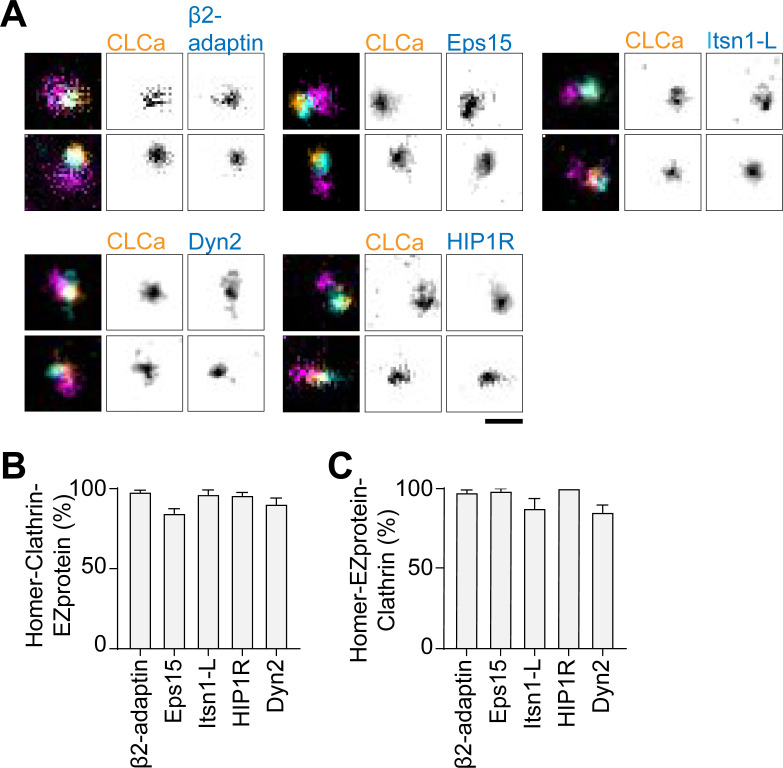
Figure 5—figure supplement 2. Endocytic proteins colocalize with the EZ.

Figure 5—figure supplement 2.

(A) Examples of endogenous Homer1b/c (eHomer1b/c) labelled with anti-Homer1 antibody (magenta), combined with Halo-CLCa labeled with JF646 (orange) and co-expressed with endocytic proteins fused to GFP labeled with CF568 (cyan). eHomer1b/c was imaged using confocal, for CLCa and endocytic proteins gSTED was applied. Scale bar: 500 nm. (B) Percentage of eHomer1c-associated CLCa puncta overlapping with endocytic protein signal. (C) Percentage of eHomer1c-associated endocytic protein puncta overlapping with CLCa signal. Bar graphs show mean ± SEM, normalized to the average of the representative controls described in Materials and method section.
Figure 5—figure supplement 2—source data 1. Excel sheet with numerical data represented as plots in Figure 5—figure supplement 2B,C.