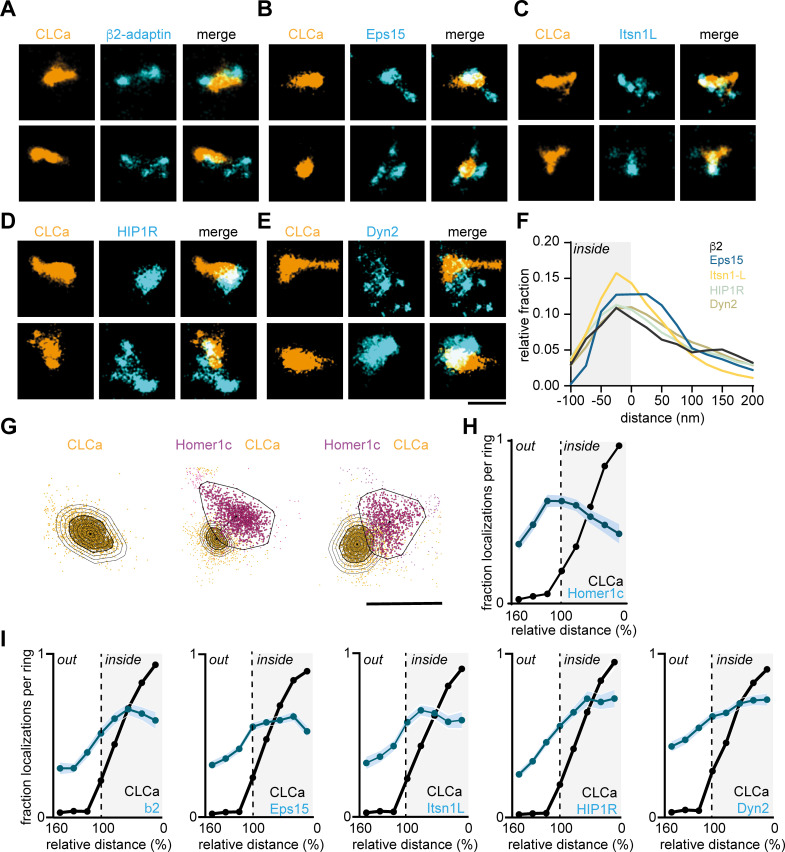
Figure 6. Endocytic proteins have distinct spatial organization relative to the clathrin structure marking the EZ.
(A–E) High-resolution example images of Halo-CLCa labelled with JF647 (orange) co-expressed with endocytic proteins fused to GFP labelled with CF568 (cyan). Scale bar: 500 nm. (F) Histogram visualizing the relative frequency of the distance of individual localizations relative to the border of CLCa. (G) Example plots of CLCa with rings based on the size of the structure (left panel), and example plots of individual CLCa and Homer1c localizations. The border outlining the EZ (bold black outline around the orange localizations) represents the 100% mark in graphs H and I. Scale bar: 500 nm. (H) Fraction of localizations per ring. Dotted line depicts the border of CLCa (Homer1c n = 65, CLCa n = 66). (I) Fraction of localizations per ring. Dotted line depicts the border of CLCa. β2-adaptin (n = 87), GFP-Eps15 (n = 126), GFP-Itsn1L (n = 58), GFP-HIP1R (n = 72), GFP-Dyn2 (n = 82).

