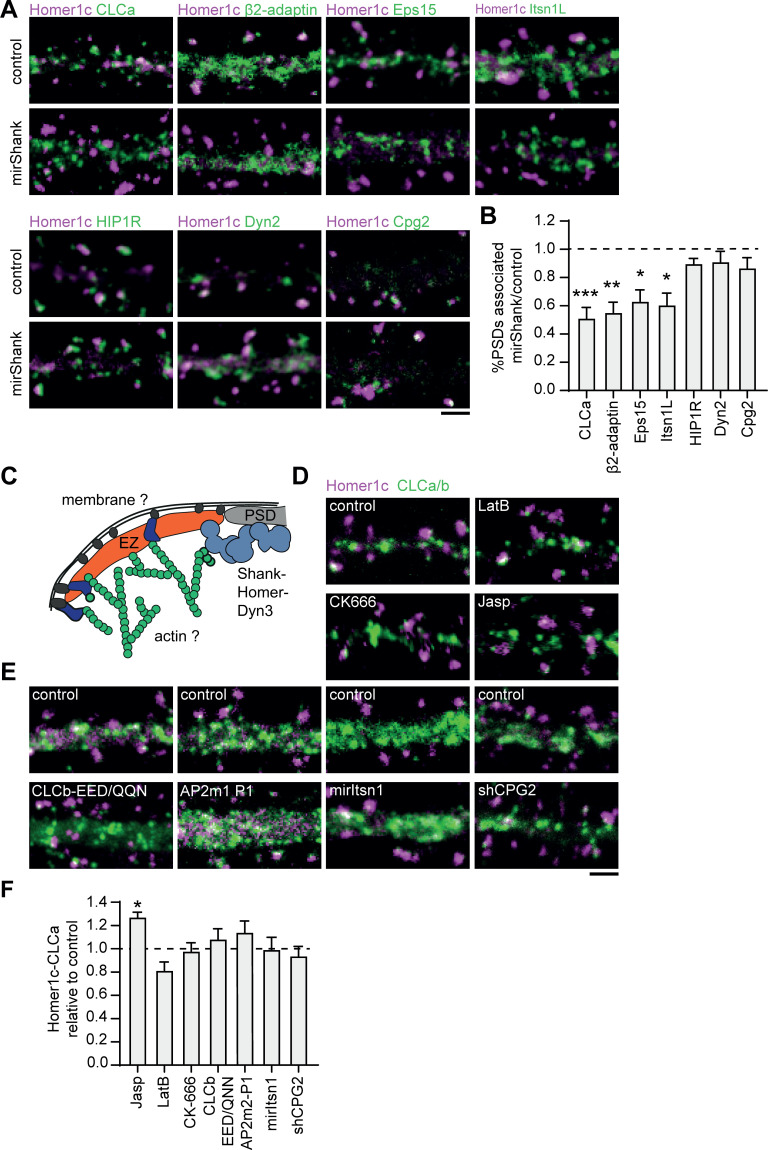
Figure 7. Interactions with the PSD, but not with the membrane or actin cytoskeleton are required for positioning of the EZ.
(A) Example images of dendrites expressing Homer1c-ALFA and endocytic proteins fused to GFP co-expressed with control or mirShank-mCherry construct. Scale bar: 2 µm. (B) Fraction of PSDs associated with an EZ after Shank-KD relative to control plotted as mean ± SEM. GFP-CLCa (N = 8, p < 0.001), β2-adaptin (N = 10, p < 0.01), Eps15 (N = 12, p < 0.05), Itsn1L (N = 10, p < 0.05), HIP1R (N = 11 p > 0.05), Dyn2 (N = 12, p > 0.05), CPG2 (N = 13, p > 0.05). (C) Illustration of possible mechanisms that could maintain the EZ adjacent to the PSD. (D) Example images of dendrites co-expressing Homer1c-ALFA and GFP-CLCa in dendrites treated with LatB, CK666, or Jasp. Scale bar: 2 µm. (E) Example images of dendrites expressing control constructs, CLCb-EED/QQN (left panel) and AP2m2-P1 (middle panel), or Itsn1 KD construct (mirItsn1; right panel). Scale bar: 2 µm. (F) Fraction of EZ-associated PSDs relative to control, plotted as mean ± SEM. Jasp (N = 4), LatB (N = 8), CK666 (N = 12), CLCb-EED/QQN (N = 7), AP2m2-P1 (N = 5), mirItsn1 (N = 11), shCPG2 (N = 8).

