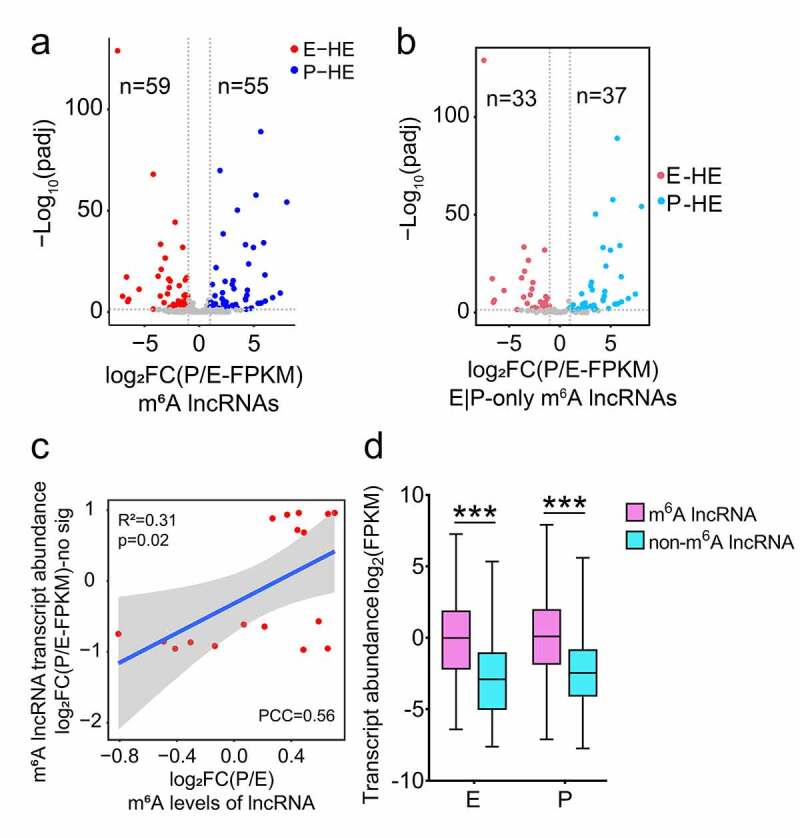
Figure 4.

Expression features of m6A methylated lncRNAs at E- and P-stage. (a) Volcano diagram shows the expression patterns of m6A methylated lncRNAs in E- and P-stage cortices. Red dots and blue dots represent 59 and 55 significantly differentially expressed m6A methylated lncRNAs at E- and P-stage, respectively. Grey dots represent m6A methylated lncRNAs with no significantly differential expression at E- and P-stage. Criteria for filtering significantly differentially expressed m6A methylated lncRNAs were padj < 0.05, log2FC (P/E-FPKM) > 1 or < −1. (b) Volcano diagram shows the expression patterns of lncRNAs m6A methylated at only E- and P-stage. Red dots and blue dots represent 33 and 37 significantly differentially expressed lncRNAs only m6A methylated at E- and P-stage. Grey dots represent lncRNAs with no significantly differential expression and m6A methylated only at E- and P-stage. Criteria for filtering significantly differentially expressed m6A methylated lncRNAs were padj < 0.05, log2FC (P/E-FPKM) > 1 or < −1. (c) Scatter plot shows the positive correlation between m6A levels and transcript abundance of lncRNAs with no significantly differential expression at E- and P-stage (PCC > 0.25 and p < 0.05). Criteria for filtering significantly differentially expressed m6A methylated lncRNAs were padj < 0.05, log2FC (P/E-FPKM) > 1 or < −1. (d) Box plot represents the comparison of transcript abundance of m6A methylated lncRNAs and non-m6A methylated lncRNAs at E- and P-stage. p values were determined by unpaired student’s t-test, ***: p < 0.01. E: p= 2.003e-53; P: p = 5.705e-31. E: E-stage; P: P-stage; HE: highly enriched; FC: fold change; FPKM: fragments per kilobase of transcript per million mapped reads; PCC: Pearson correlation coefficients; R2: the goodness-of-fit for the linear regression model
