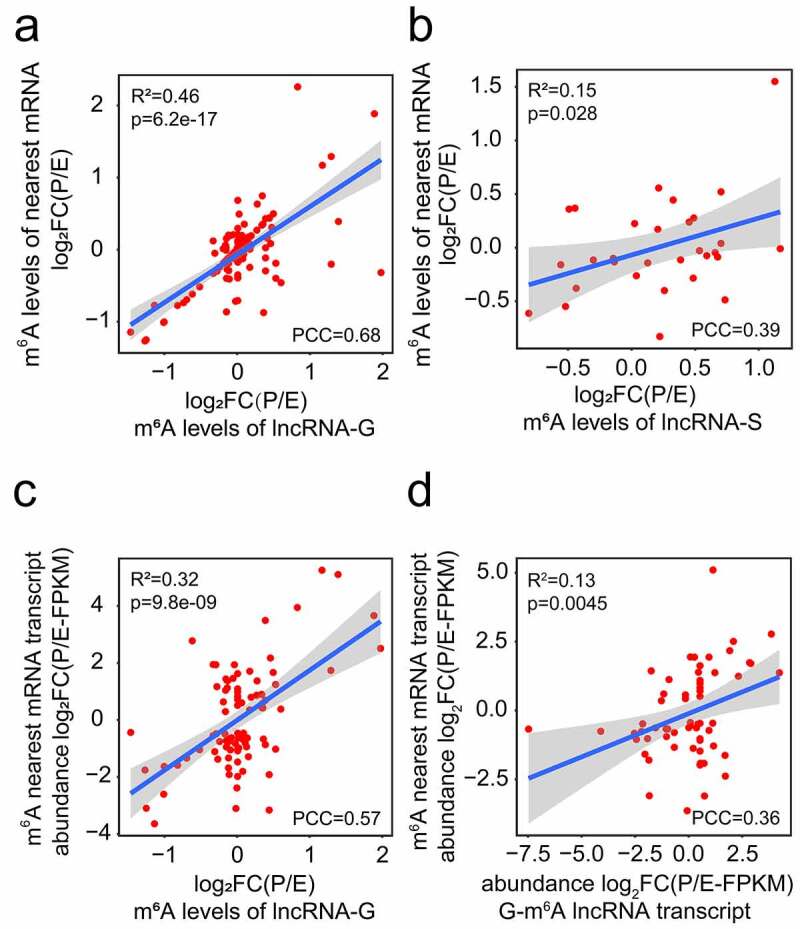
Figure 6.

Correlation analyses of m6A methylated lncRNAs and their nearest mRNAs at E- and P-stage. (a, b) The positive correlation of m6A levels of genic (a) and separated (b) lncRNAs with their nearest mRNAs at E- and P-stage. (c) The positive correlation between the m6A levels of genic lncRNAs and the transcript abundance of their nearest mRNAs. (d) The positive transcript abundance correlation between the genic m6A lncRNAs and the m6A methylated nearest mRNAs. FC: fold change; PCC: Pearson correlation coefficients; R2: the goodness-of-fit for the linear regression model; FPKM: fragments per kilobase of transcript per million mapped reads. The correlation criteria were PCC > 0.25 and p < 0.05
