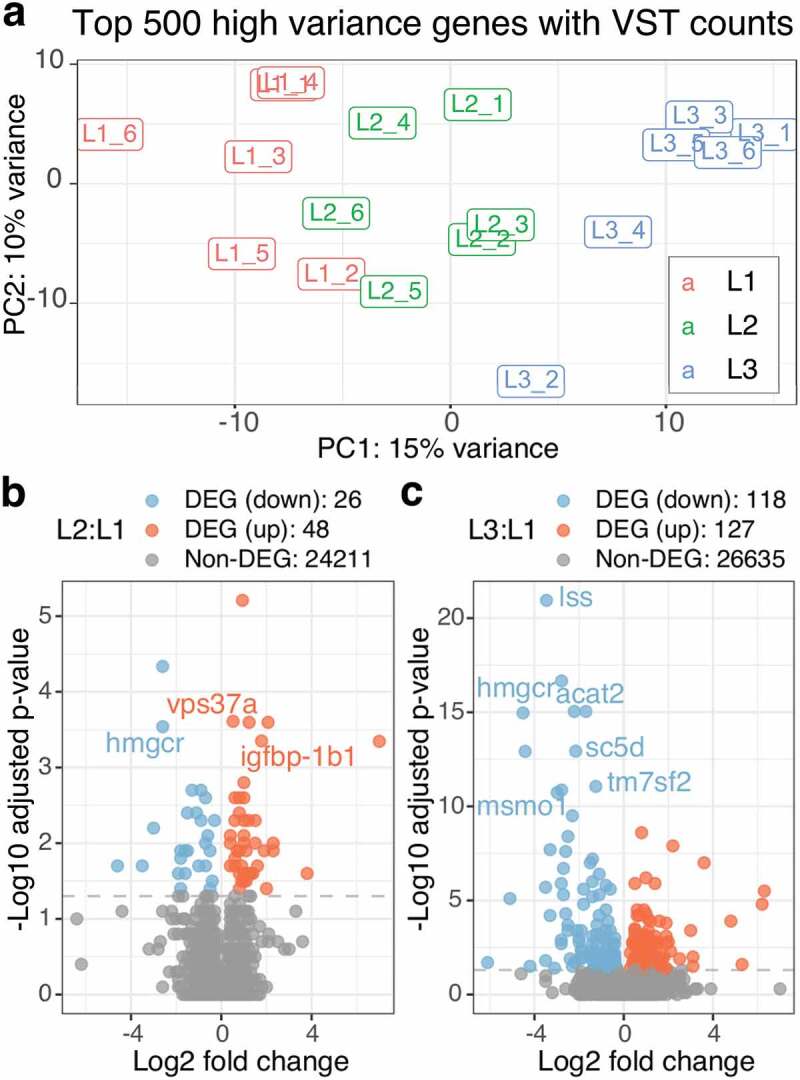
Figure 2.

Both L2 and L3 diet significantly affect gene expression but L3:L1 show more DEGs than L2:L1. a) The PCA bi-plot shows top 500 high variance genes of RNA-seq counts with VST (variance stabilization transformation). The three diet groups are indicated by colours as red for L1, green for L2 and blue for L3. b) and c) Two volcano plots show log2 fold changes vs -log10 adjusted p-values for L2:L1 and L3:L1. Gene symbols (when available) are shown for the genes with -log10 adjusted p-value > 3 for L2:L1 and -log10 adjusted p-value > 10 for L3:L1
