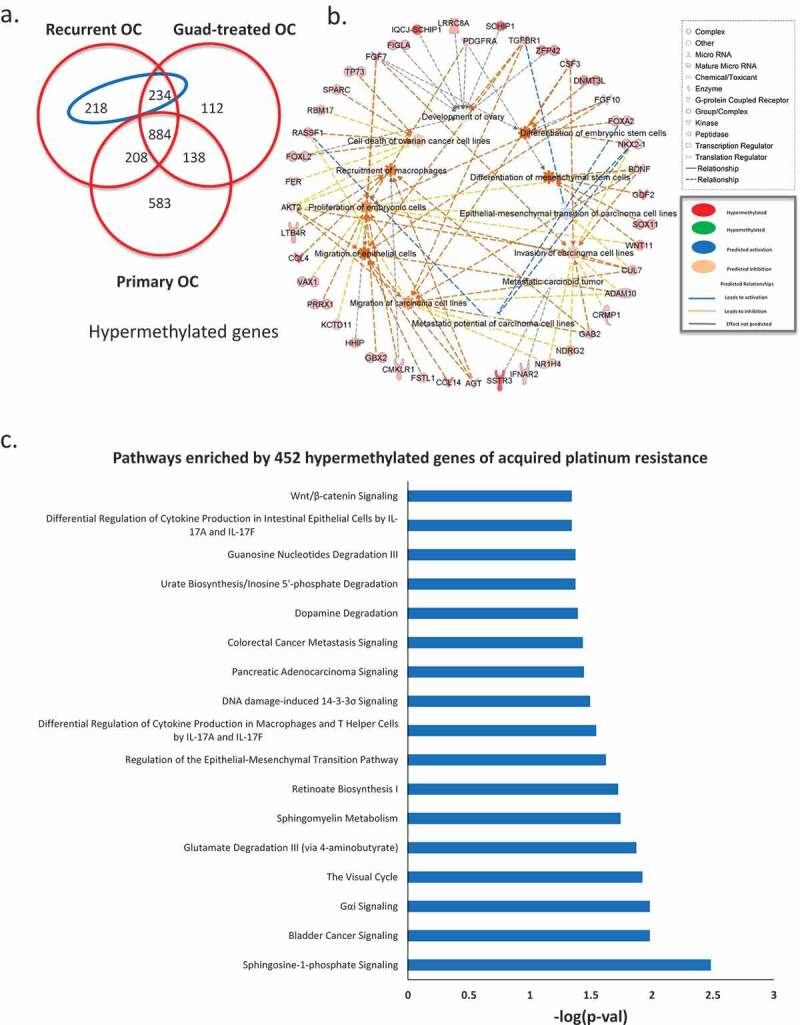
Figure 2.

Methylomic changes during acquired platinum resistance. (a) Venn diagram shows unique and common hypermethylated genes in all three ovarian tumour groups, in the blue ellipse, 452 genes identified hypermethylated during acquired platinum resistance (hypermethylated in recurrent but not in primary OC). (b) Gene ontology analysis of the 452 genes hypermethylated in recurrent OC, different shapes on the out layer are genes from 452 gene list, whereas the ones in the middle are different gene ontology terms enriched by those genes from the outer layer. (c) Pathways enriched by 452 hypermethylated genes during acquired platinum resistance
