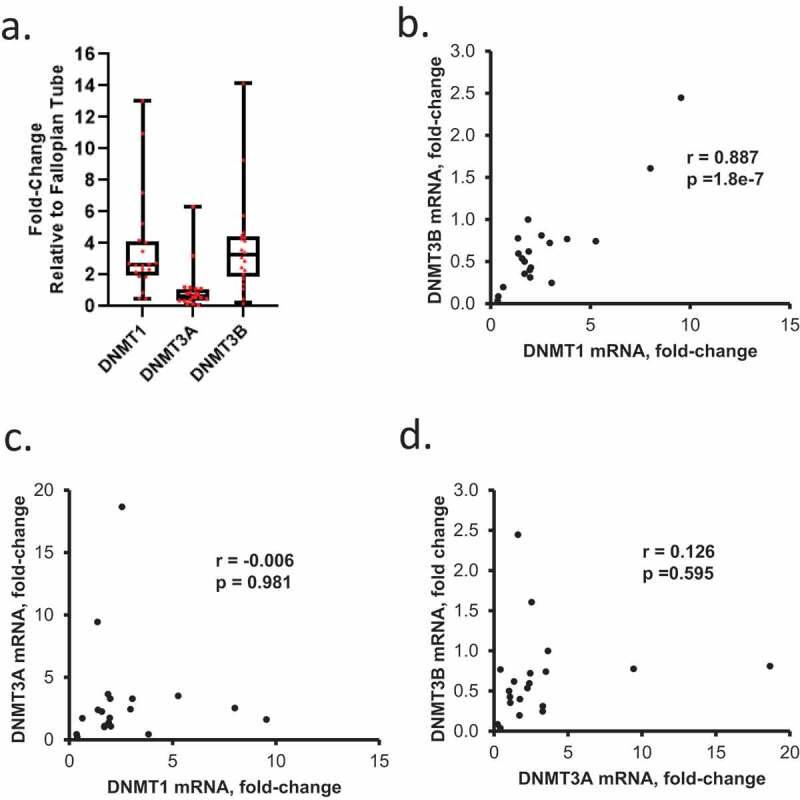
Figure 5.

Expression levels of DNMT1, DNMT3A, and DNMT3B mRNAs in OC tumours. (a) DNMT1 and DNMT3B mRNA levels are positively correlated in HGSOC tumours. Box plots show medians and 25–75% quartiles of DNMT mRNAs levels measured by real-time RT-PCR in HGSOC primary tumours (n = 20, Sample/Patient Group 1) relative to fallopian tube epithelium. (b-d) Scatter plots and correlation coefficients between mRNA levels of DNMT1 and DNMT3B (b), DNMT1 and DNMT3A (c), or DNMT3A and DNMT3B (d) in HGSOC primary tumours (n = 20, Sample/Patient Group 1)
