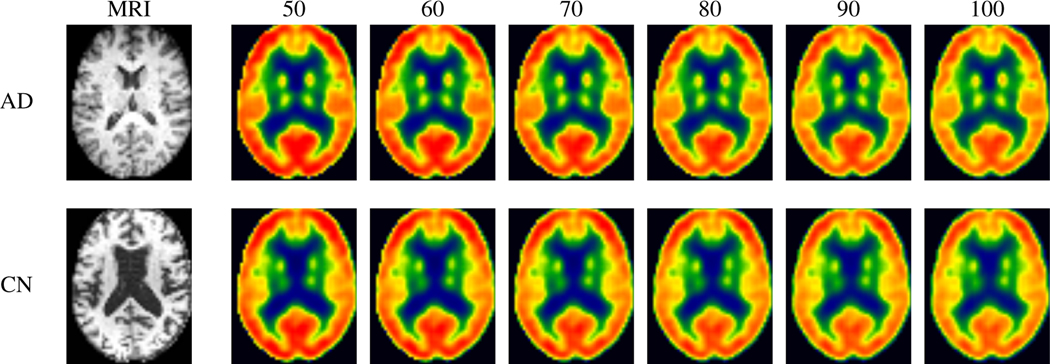
Figure 6: Conditioning on age should yield generated images that show increased hypometabolism with age.
These are representative results from our PET generation as a function of age. As we scan left to right, we indeed see a decrease in metabolism (less red, more yellow) which is completely consistent with what we would expect in aging.

