
Figure 3.
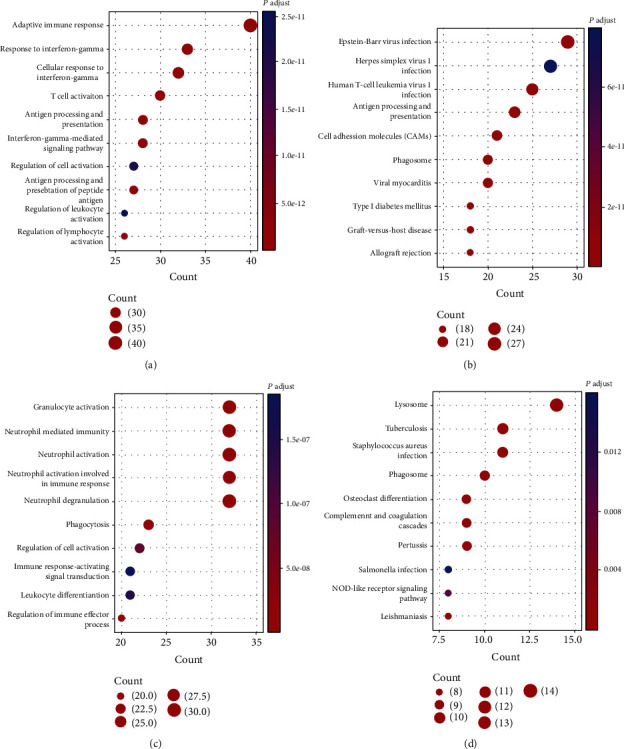
Functional enrichment analysis of genes in the green/yellow and tan modules in the KIRC patients. (a, b) Biological process analysis of GO enrichment and KEGG pathway analysis for genes in the green/yellow module. (c, d) Biological process analysis of GO enrichment and KEGG pathway analyses for genes in tan module.