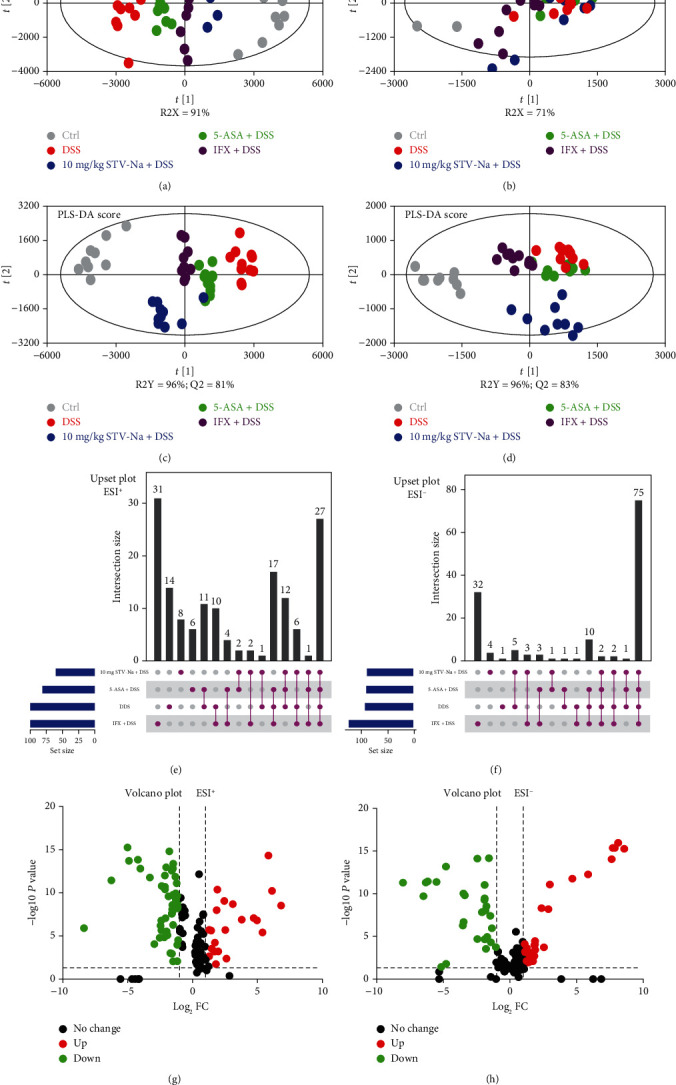
Figure 6.

STV-Na modulated deranged metabolic profiles of the DSS models of chronic colitis. (a, b) PLS-DA score plots of plasma samples obtained from different groups in the ESI positive ion mode (a) and negative ion mode (b). (c, d) Score plot generated from the PLS-DA model of different groups in the ESI positive ion mode (c) and negative ion mode (d). (e, f) UpSet analysis showing the potential metabolite numbers detected in each group and their intersections in the ESI positive ion mode (e) and negative ion mode (f). Horizontal bar graphs show total metabolites characterized in each group. Vertical bars display intersections between groups. (g, h) Volcano plot showing the differential variables between the different groups. “Up” indicates upregulation, “down” indicates downregulation, and “no change” indicates no significant difference.
