Figure 7.

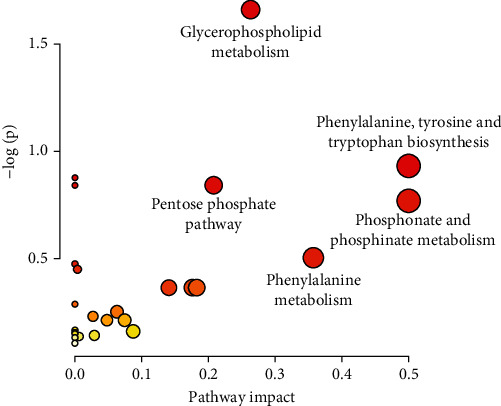
Metabolic pathways involving potential metabolites in plasma. The circle colors indicate the P value (y-axis), while the circle sizes indicate the pathway impact (x-axis).

Metabolic pathways involving potential metabolites in plasma. The circle colors indicate the P value (y-axis), while the circle sizes indicate the pathway impact (x-axis).