Figure 1.

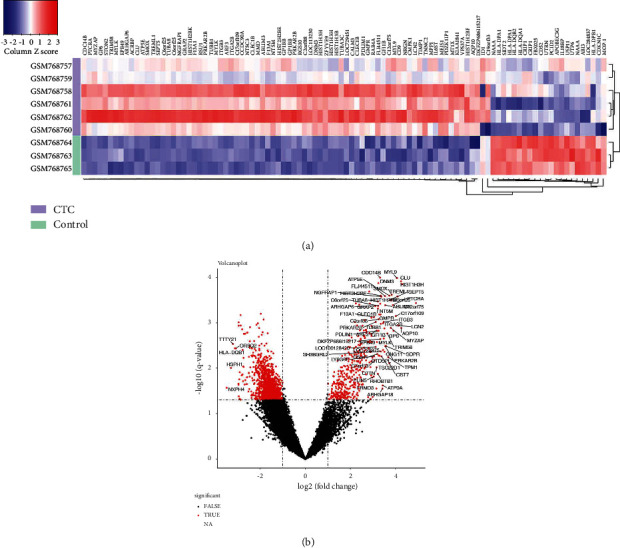
Identification of differentially expressed genes (DEGs) between circulating tumor cells (CTCs) and normal control groups. (a) The identified DEGs displayed in heat map. (b) The identified DEGs displayed by volcano plot.

Identification of differentially expressed genes (DEGs) between circulating tumor cells (CTCs) and normal control groups. (a) The identified DEGs displayed in heat map. (b) The identified DEGs displayed by volcano plot.