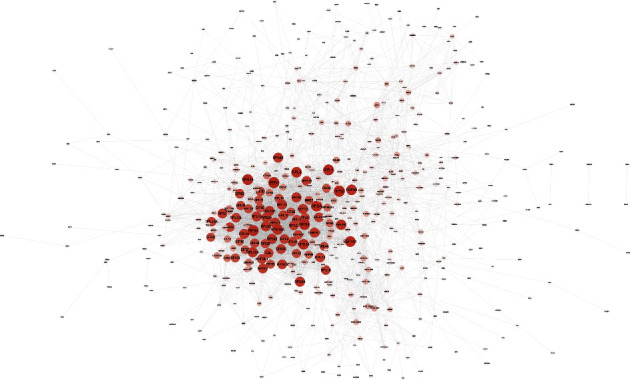
Figure 3.

The protein-protein interaction (PPI) networks and the network analysis of enrichment results of DEGs. Nodes indicated each DEG. Lines represented in-between interactions. The size of each node and density of color were in proportion to the degrees.
