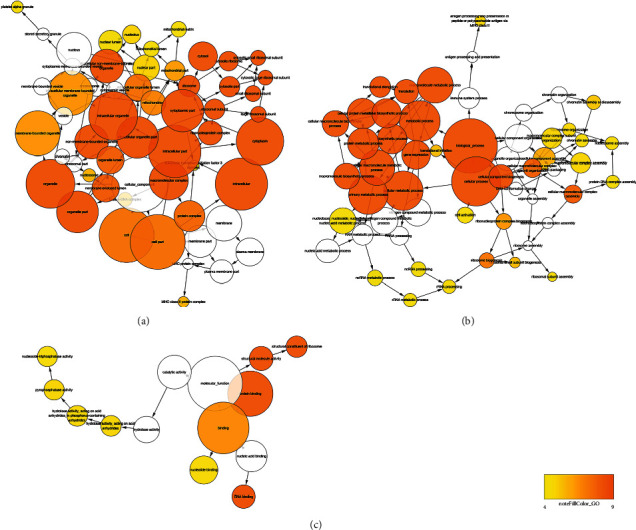
Figure 4.

The network analysis of enrichment results of DEGs. (a) The enrichment of cellular components. (b) The enrichment of biological processes and the density of color were in proportion to the significance. (c) The network analysis of enrichment results of molecular functions by DEGs. The density of color was in proportion to the significance.
