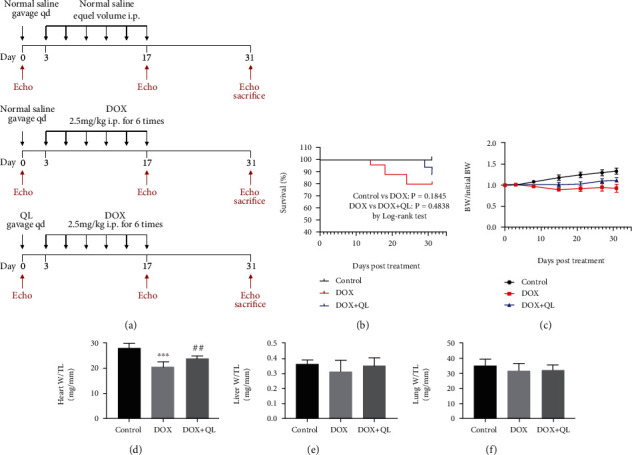
Figure 2.

The impacts of QL treatment on survival rate, weight loss, cardiac mass, liver mass, and lung mass in DOX-treated rats. (a) The schematic diagram of this study. (b) Survival curve and (c) body weight change of rats in three groups during the experiment. (d–f) The ratios of heart weight, lung weight, and liver weight to tibial length (TL) among three groups at the end of the experiment (values are presented as mean ± SD; ∗∗∗P < 0.001 vs. control group; ##P < 0.001 vs. DOX group).
