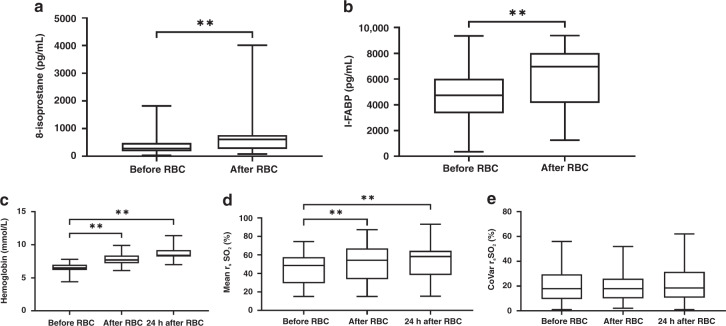
Fig. 2. Urinary 8-isoprostane and I-FABP, hemoglobin level, and splanchnic oxygen saturation at several time points before and after red blood cell transfusion.
a 8-isoprostane before and after red blood cell transfusion. b I-FABP before and after red blood cell transfusion. c Hemoglobin level before, after, and 24 h after red blood cell transfusion. d Mean splanchnic oxygen saturation before, after and 24 h after red blood cell transfusion. e CoVar of splanchnic oxygen saturation before, after and 24 h after red blood cell transfusion. Data are presented as box-and-whisker plots; **p < 0.01; RBC red blood cell transfusion, I-FABP intestinal fatty acid-binding proteins, rsSO2 splanchnic tissue oxygen saturation, CoVar coefficient of variation (calculated as (SD/mean)*100%).

