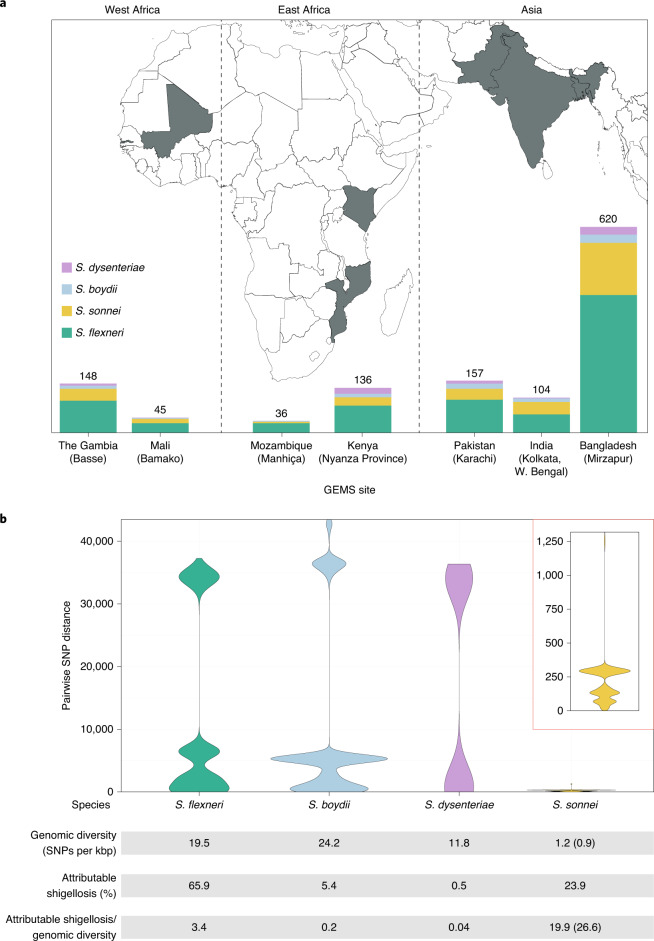
Fig. 1. The diversity of Shigella spp. across seven LMICs.
a, Stacked bar graphs illustrate the number of isolates from each Shigella spp. sequenced from GEMS and used in the current study, grouped by country. The seven countries from GEMS are highlighted in grey on the map and the selected field site(s) from each country are shown in brackets. b, Violin plots of pairwise genomic distances (in SNPs) among Shigella isolates within subgroups. Inset: a magnified plot for S. sonnei. The table below the plots shows the genomic diversity (as measured by the total number of SNPs per kbp (Methods)), the contribution to GEMS shigellosis burden and the shigellosis burden relative to genomic diversity for each species. For S. sonnei, the genomic diversity and shigellosis burden relative to genomic diversity calculated excluding the two outliers are shown in brackets.

