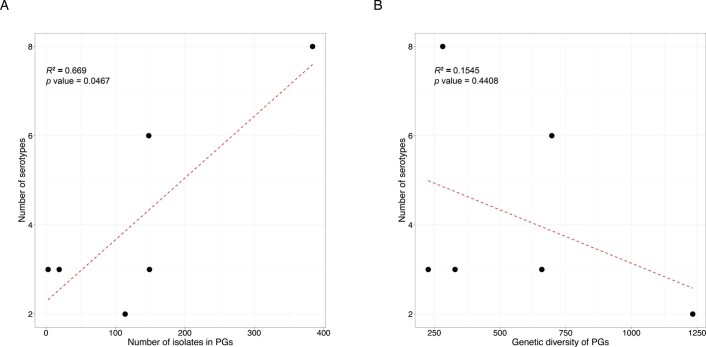
Extended Data Fig. 5. Association of S. flexneri serotype diversity with different properties of a genomic subtype.
Each of the six subtypes identified among S. flexneri (PG1-PG7 and Sf6), the number of different serotypes is displayed along the y-axis and plotted against (A) the number of isolates within the subtype and (B) the genetic diversity of the subtype, as measured by pairwise core SNP distance and plotted along the x-axis. Linear regression analysis was performed to assess the association between serotype diversity and the different properties of subtypes. The regression coefficient of determination (R2) and p-value are displayed on the top left of each plot.

