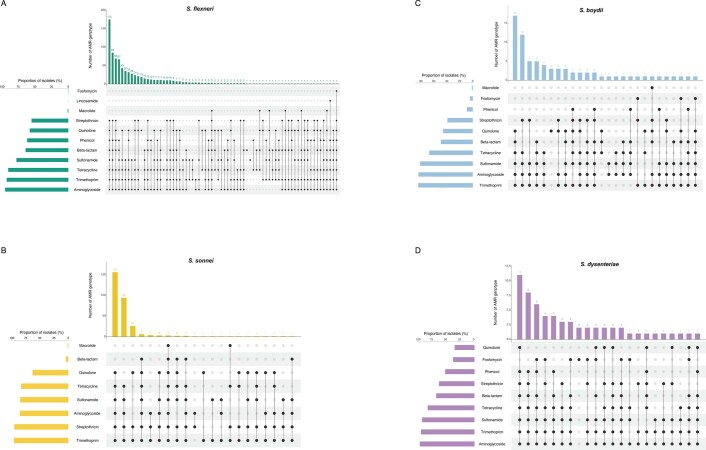
Extended Data Fig. 9. Diversity of AMR genotype resistance profiles.
UpSet plots illustrate the AMR genotype resistance profiles for (A) S. flexneri, (B) S. sonnei, (C) S. boydii and (D) S. dysenteriae. Genotypic AMR profiles are shown in the combination matrix in the center panel. Each column represents a unique genotypic profile, where each black dot represents presence of a genetic determinant conferring resistance or reduced susceptibility to a drug class (displayed on the left). The vertical the barplot above the matrix displays the number of isolates with a particular profile, with the exact number of isolates displayed above each bar. The horizontal barplot on the left of the matrix illustrates the proportion of isolates containing AMR genetic determinants associated with a drug class.

