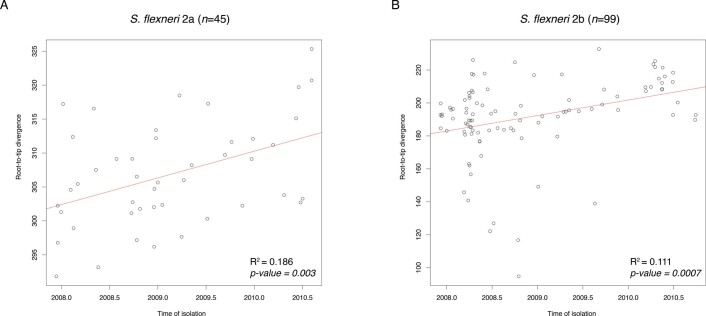
Extended Data Fig. 10. Temporal phylogenetic signal for S. flexneri.
Correlation between isolate sampling time in months (x-axis) and phylogenetic root-to-tip divergence (y-axis), as estimated by TempEst based on ML phylogeny of each subclade. The two datasets correspond to S. flexneri serotype 2a isolates belonging to node A (A) and S. flexneri serotype 2b isolates belonging to node B (B) from PG3 in Supplementary Fig. 12. The linear regression line is coloured in red, with the coefficient of determination (R2) and p-value displayed for each plot.

