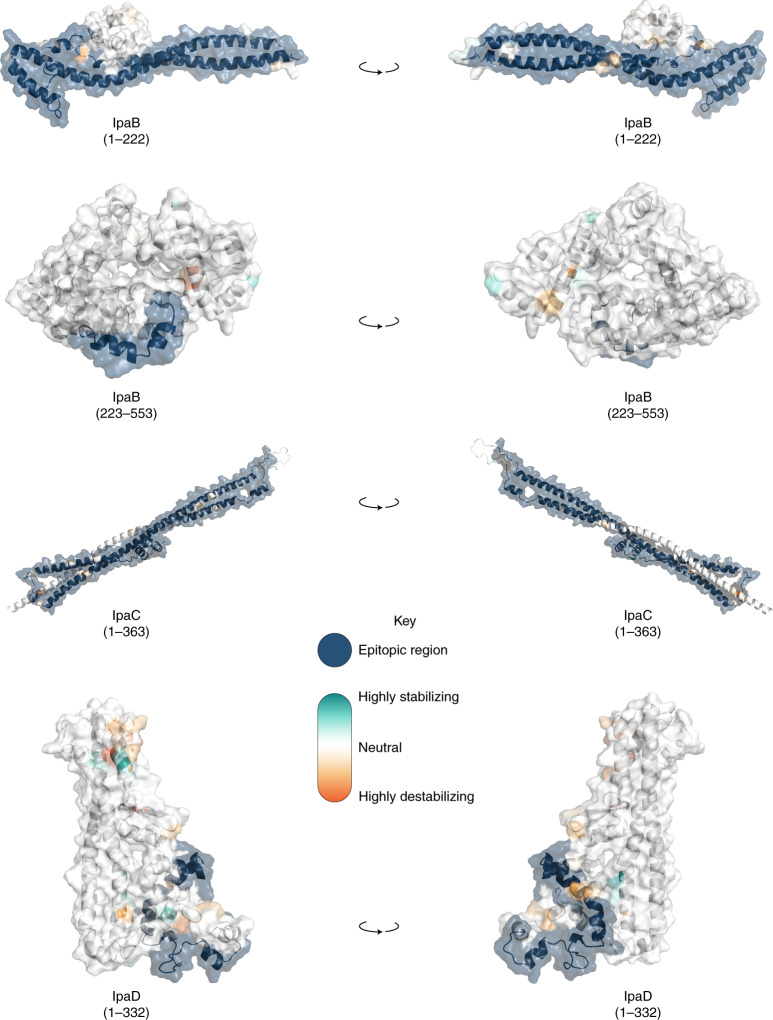
Fig. 4. Visualization of mutations and its predicted effect on modelled IpaB, IpaC and IpaD protein antigens.
Visualization of mutations on modelled proteins IpaB, IpaC and IpaD. The protein residue ranges modelled are shown in brackets. Blue regions represent empirically determined epitopes. Mutations identified within the proteins are coloured using the scale shown in the inlaid key. Visualisations in the right hand column are 180-degree rotations of the models relative to the left hand column.

