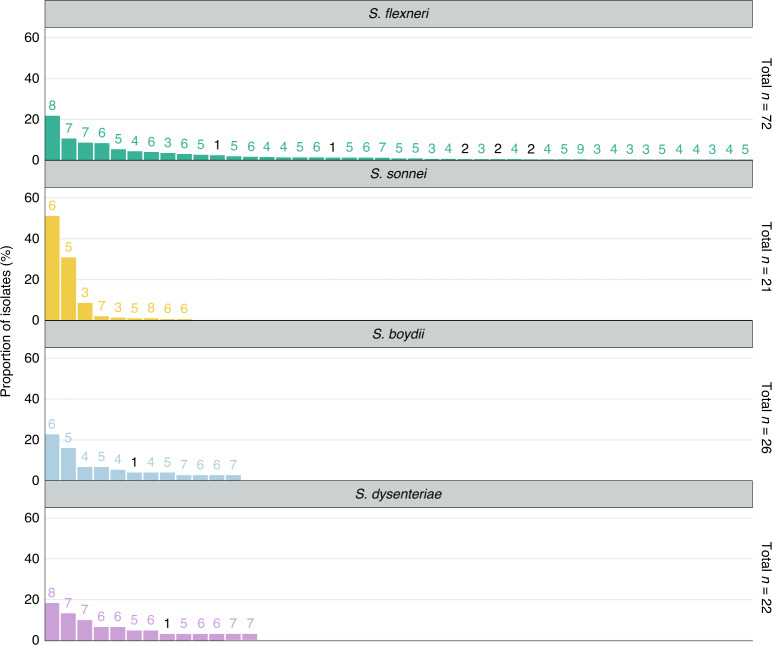
Fig. 5. AMR genotypic profile diversity among Shigella spp.
Each barplot represents the frequencies of AMR genotypic profiles among individual Shigella species. The number of bars shown along the x axis represents the number of unique genotypic AMR profiles detected in each species and plotted against the proportion of isolates belonging to each profile (y axis). The numbers above each profile indicate the number of antimicrobial classes impacted by the genotype. Profiles that impact only one or two antimicrobial classes (that is, are not MDR) are highlighted in black. AMR profiles identified in only a single isolate were not plotted and are displayed in Extended Data Fig. 9. The total number of profiles detected within each species are displayed on the right-hand side of each plot.

