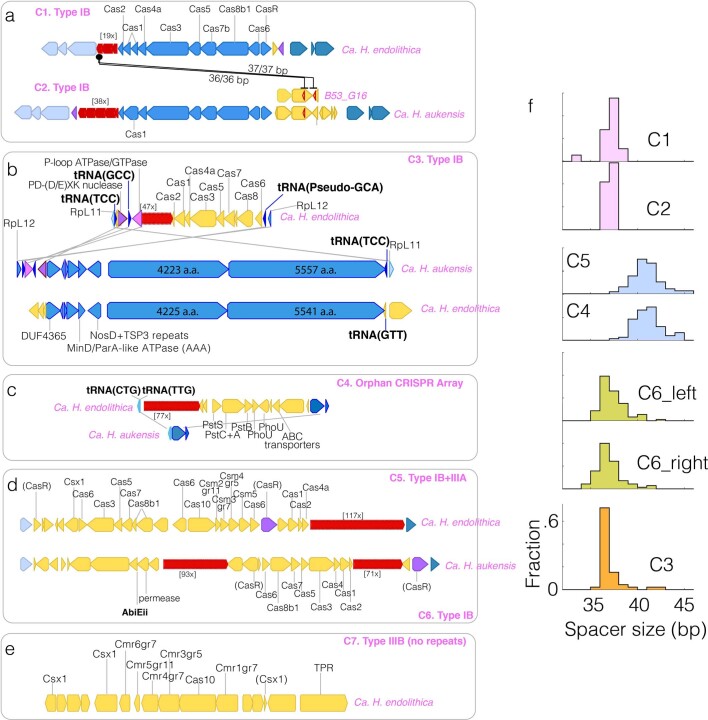
Extended Data Fig. 5. CRISPR/Cas systems in Ca. Heimdallarchaeum spp.
a-e. Schematic showing the gene synteny of the CRISPR/Cas systems (serial numbers and operon types are in bold pink) and their alignments between the two genomes. Genes conserved between the two genomes are labeled in various shades of blue and purple to assist visualization. Genes only appearing in one of the genomes are in yellow. Red indicates CRISPR arrays. Array sizes are indicated by the number of repeats such as [77x]. In b, The Aloposons with giant genes are also shown to illustrate their site-specific integration. f. Size distribution of spacers in each CRISPR array.

