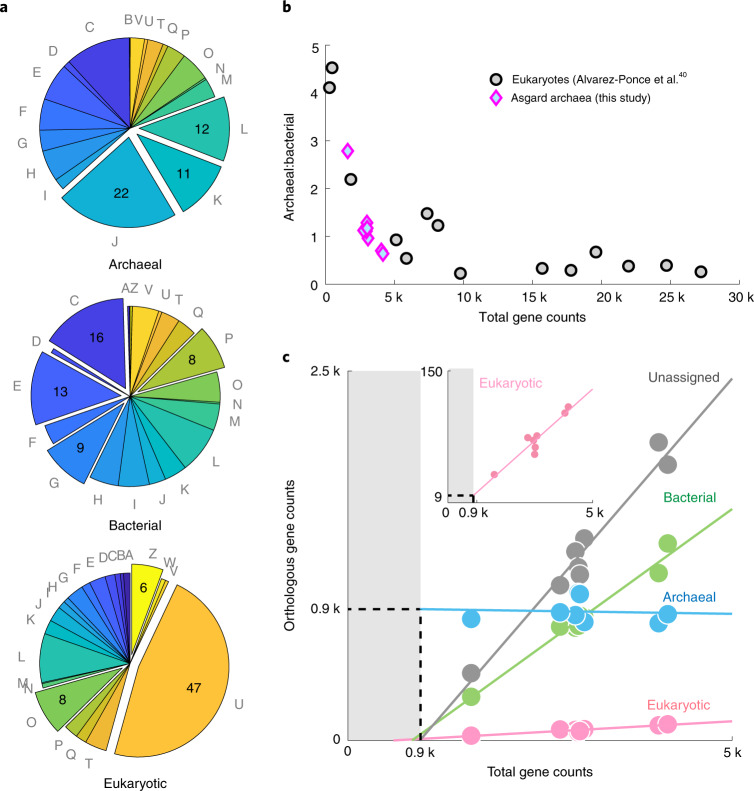
Fig. 5. Functional and taxonomic profiling of gene content cross Asgard archaea.
a, COG classification of genes within the Asgard archaea subdivided into closest taxonomic groups using eggNOG. The expanded wedges in each pie chart highlight the top categories preferentially enriched in the taxonomic group than other groups. They respectively indicate translation (J), transcription (K), replication and repair (L), energy production and conversion (C), the metabolism and transport of amino acids (E), carbohydrates (G) and inorganic ions (P), intracellular trafficking and secretion (U) and cytoskeleton (Z) and protein modification (O). The remaining groups can be found in Tatusov et al.40. The numbers indicate the percentages. Note that proteins with unknown function are excluded from each pie chart. b, The archaeal:bacterial gene ratio decreases with increasing genome size in both Asgard archaea (this study) and eukaryotes (data from Alvarez-Ponce et al.41). c, Numbers of genes related to different taxonomic groups in relation to the total number of genes in the representative genomes of the Asgard archaea indicate different scaling properties. The solid lines represent the linear fit of the data. The dashed lines represent the extrapolated base number of archaeal genes. Unassigned means that no homology was found in the genome database. Inset, Expanded view of the genes encoding ERPs.

