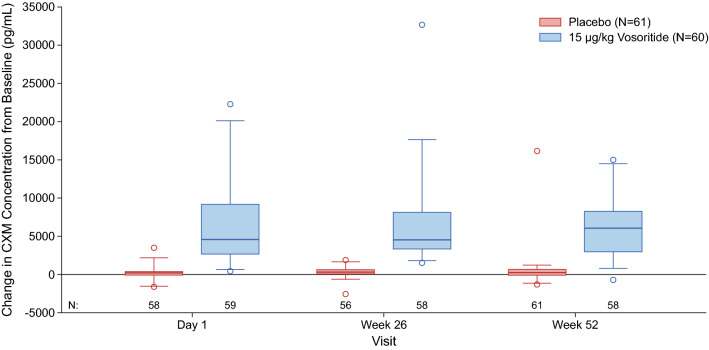
Fig. 6.
Distribution of the change in CXM from baseline from week 13 to week 52 of the phase III study. The line inside the box represents the median and the box represents the limits of the middle half of the data. The range of the box, from the first quartile (Q1) to the third quartile (Q3), defines the IQR. The standard span of the data is defined within the range from Q1 − 1.5 × IQR to Q3 + 1.5 × IQR. Whiskers are drawn to the nearest value not beyond the range of the standard span; points beyond are drawn as individual open circles. CXM collagen type X marker, IQR interquartile range

