Fig. 8.
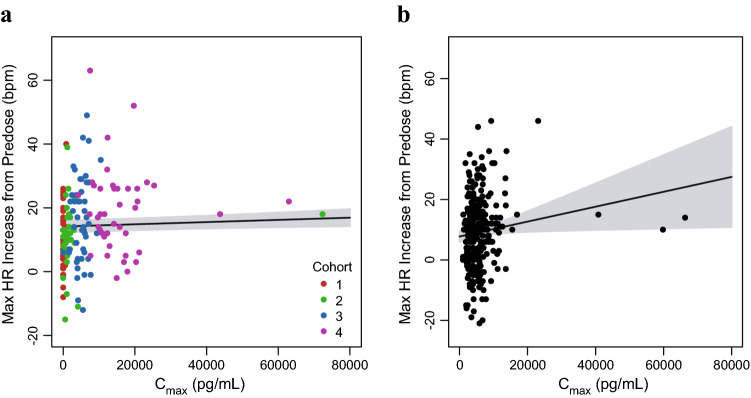
Visit-matched vosoritide Cmax in plasma and maximum increase in heart rate in the phase II and III studies. a Points represent the individual patient maximum increase in HR and individual plasma vosoritide Cmax at each visit during the initial 6 months of the phase II study, color-coded by study cohort (C1: Cohort 1, 2.5 µg/kg; C2: Cohort 2, 7.5 µg/kg; C3: Cohort 3, 15 µg/kg; C4: Cohort 4, 30 µg/kg). One patient had a high Cmax (8.39 × 10⁵ pg/mL) relative to other patients, but a within-range maximum increase in HR (39 bpm). This patient was included in the fit through the data but was not included in this figure. b Points represent the individual patient maximum increase in HR and individual plasma vosoritide Cmax at each visit during the phase III study. Solid lines represent the linear fits through the data and the shaded regions represent the 95% confidence interval. The respective analyses using the individual plasma vosoritide AUC is similar and is shown in Fig. S8 in the ESM. Cmax maximum observed plasma concentration, HR heart rate, bpm beats per min, AUC area under the plasma concentration-time curve, ESM electronic supplementary material

