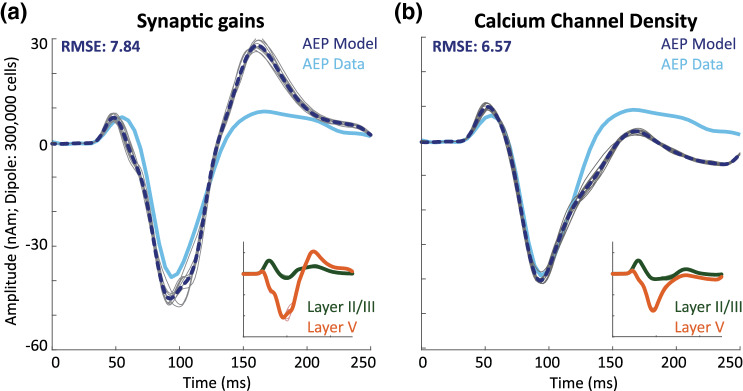
Fig. 5.
Alternative simulations for left hemisphere AEFs: left hemisphere AEFs (contralateral) are displayed in light blue, while model simulations are displayed in dark blue dotted lines. Individual simulations are displayed in gray. Inserts show the dipoles associated with layer II/III and layer V separately. The fit provided by the alternative simulations was noticeably worse than that of the initial model, which only adjusted input parameters (cf. Fig. 4b). a Synaptic gains were decreased in all connections targeting inhibitory interneurons. b Layer V pyramidal calcium channel densities were decreased. All other parameters were equal to the model of the right hemisphere AEF (see Fig. 4d–f; Table 1) (Color figure online)

