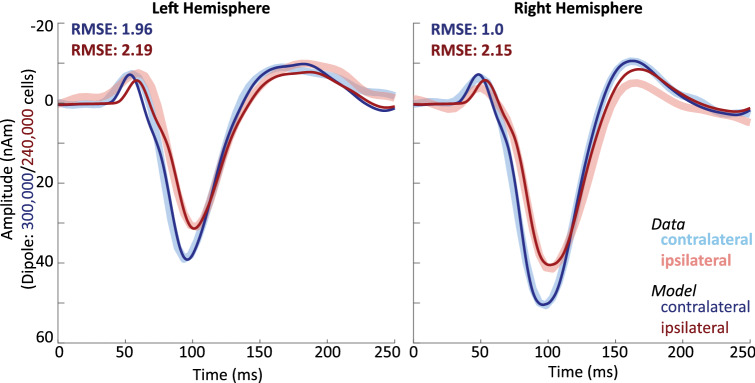
Fig. 6.
HNN simulation of the contralateral dominance effect for the right hemisphere (right panel) and the left hemisphere (left panel) AEF. Average simulations (based on 10 individual trial simulations) of contralateral AEFs (dark blue, cf. Fig. 4) and ipsilateral (dark red) AEFs. Ipsilateral responses were generated by decreasing the model scaling factor, representing the number of cells contributing to the signal, and increasing the input latencies, as compared to the contralateral simulations. Empirical AEFs are shown in light colors (cf. Fig. 2) to indicate model fit (Color figure online)

