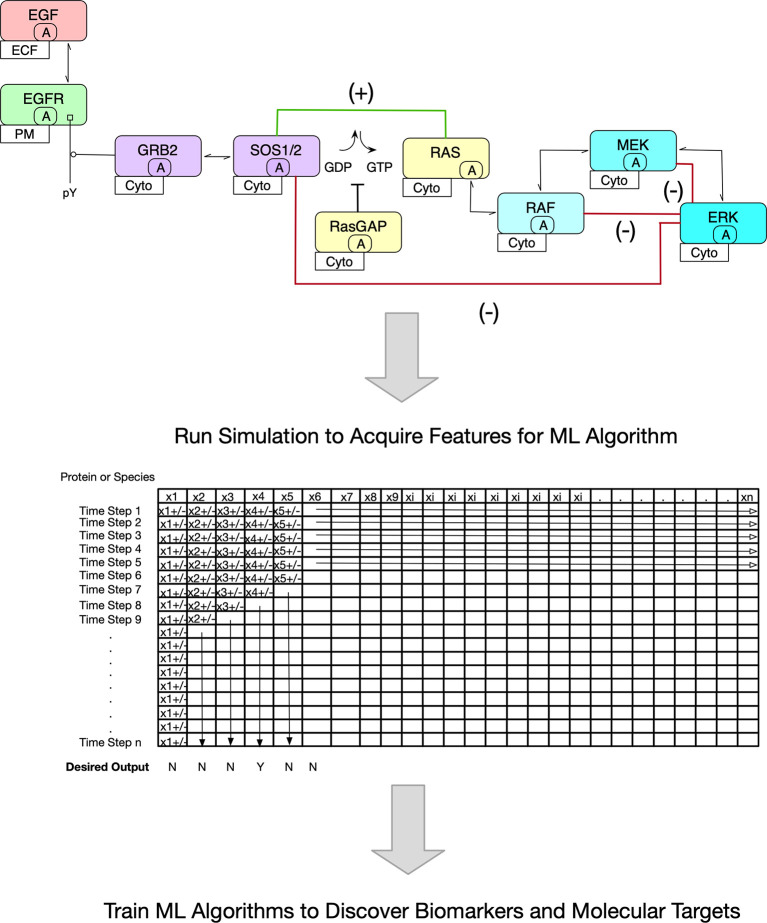
Figure 1.
Overview of Proposed Methodology. The premise of this Mini Review is pictured. In the upper portion, a stylized version of the MAPK signaling pathway is shown. The contact map shown is the basis of an ODE Model. Note the inclusion of positive (green line) and negative (red lines) feedback loops. Because of these regulatory networks, it is inherently difficult to predict outcomes such as the decision to proliferate. Further, it is more challenging to ascertain pharmacologic interventions. In the lower portion, an abstract matrix is shown that depicts the changing protein concentrations with time once an ODE model is simulated. It is these data that are useful to train ML algorithms to discover biomarkers and novel molecular targets.

