FIGURE 2.
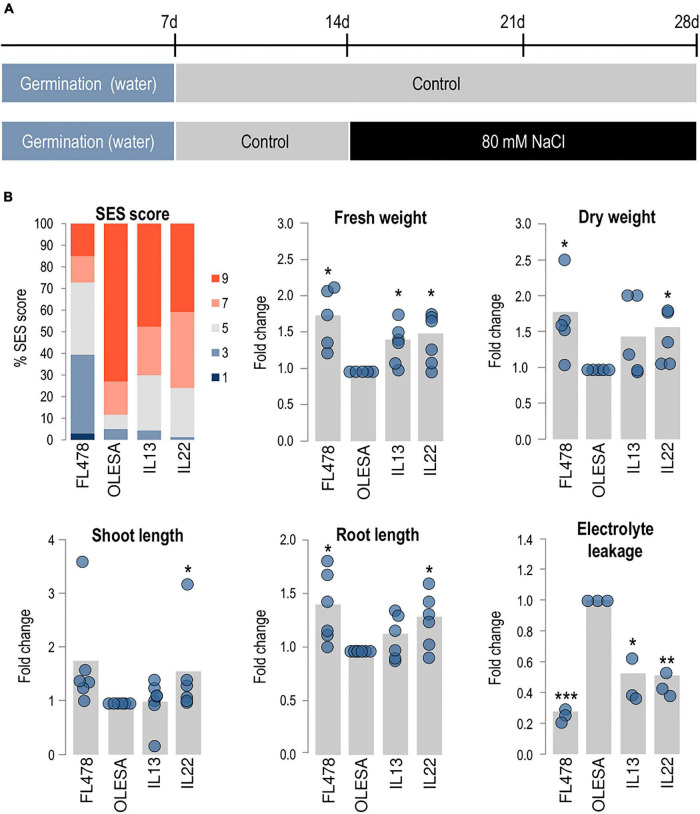
Characterization of salt tolerant introgression lines. Introgression (IL13, IL22) and parental (FL478, OLESA) lines were grown hydroponically in modified Yoshida solution and exposed to salt stress (80 mM NaCl). Student’s t-test (*P < 0.05, **P < 0.001, ***P < 0.0001). (A) Experimental design used to assess salinity tolerance. (B) Analysis of salinity tolerance at 14 days [SES scores, fresh weight (FW), dry weight (DW), shoot length (SL), and root length (RL)] or 2 days (electrolyte leakage, EL) after treatment. SES scores are shown as the percentage of plants at each score value. 1, highly tolerant; 3, tolerant; 5, moderately tolerant; 7, sensitive; 9, highly sensitive. Six independent experiments were carried out (10 plants/genotype each experiment). For FW, DW, SL, RL, and EL, values in each genotype were normalized to those in OLESA. Gray bars represent the fold change of each line in comparison to OLESA values, calculated by the means of six independent hydroponic cultures (blue dots) with 10 plants per genotype in each hydroponic assay (5 plants in control conditions). EL was measured in three independent experiments (12 plants/genotype each experiment).

