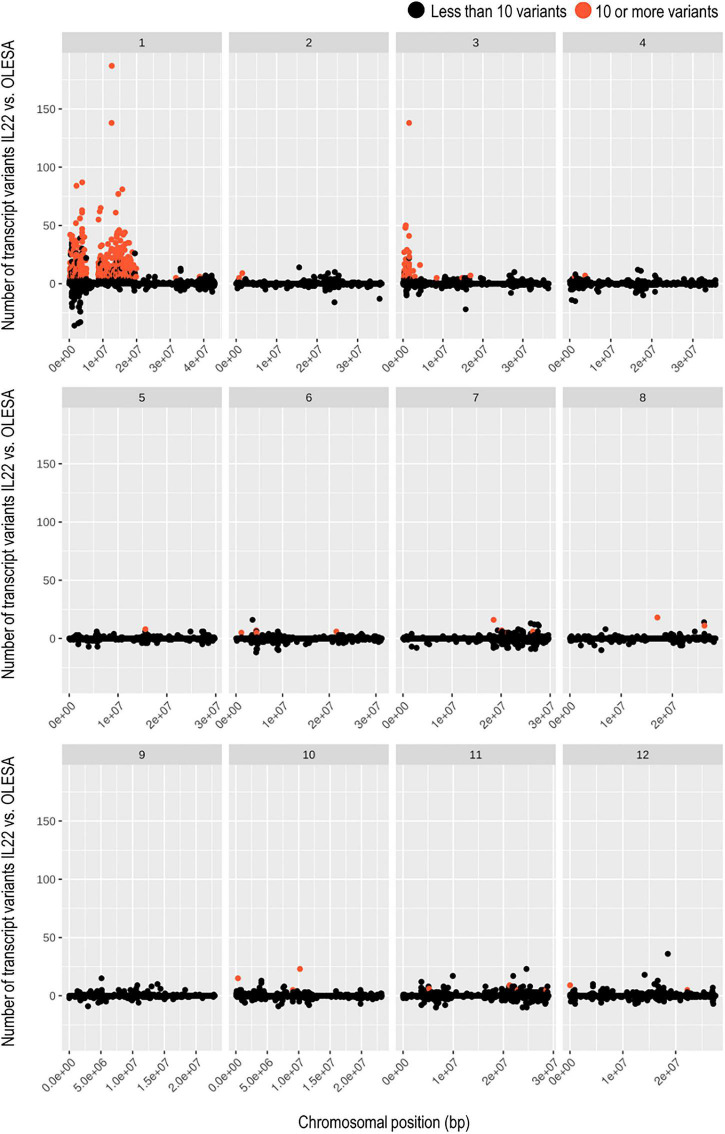
FIGURE 3.
Transcriptome-based genotyping of the introgression line IL22. Scatter plots showing the number of transcript variants for each IL22 transcript with respect to the natural variation of OLESA transcripts (both compared to japonica reference genome). Transcripts identified as indica (red dots) are those showing 10 or more variants in IL22 than in OLESA. Transcripts showing less than 10 transcript variants in IL22 compared to OLESA were considered japonica. Each chromosome (1–12) show their scatter plot and transcripts are sorted by chromosomal position, indicated in the x-axis.

