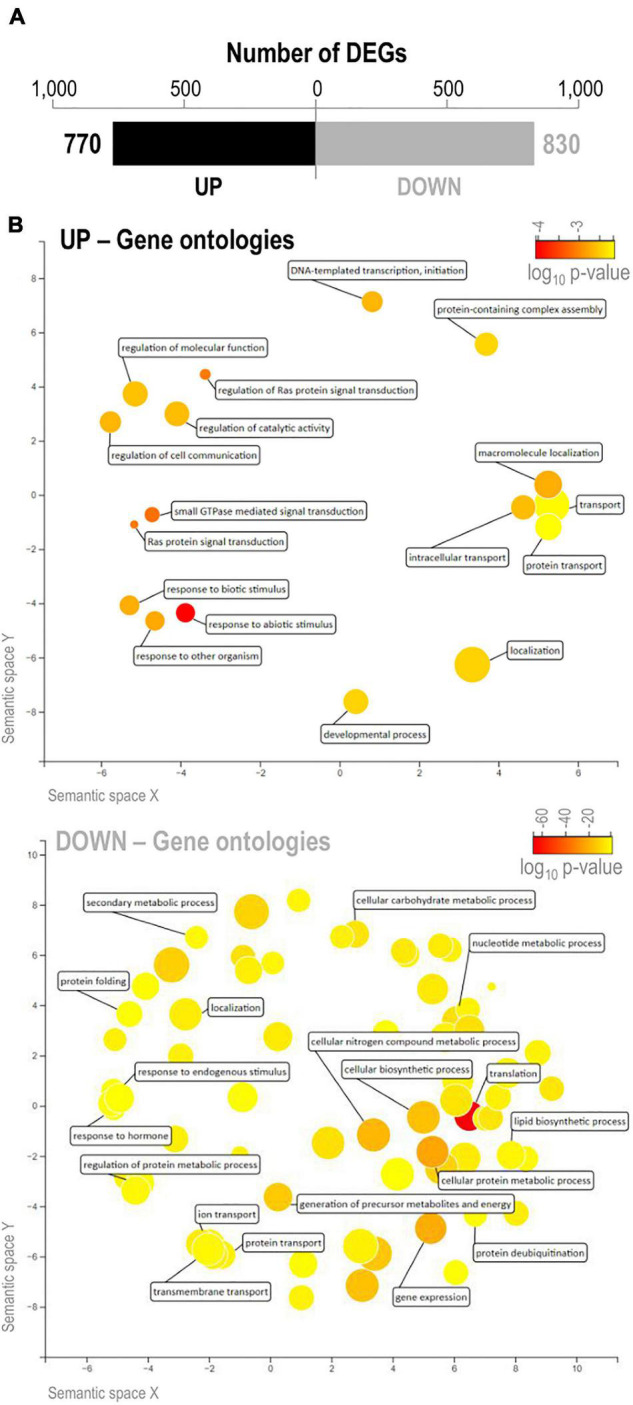
FIGURE 6.

Differentially expressed genes in leaves of IL22 plants relative to OLESA plants. Plants grown in hydroponic culture under control conditions as indicated in Figure 2. Leaves of 2-week-old plants were used for RNA-Seq analysis. (A) Number of DEGs (black, up-regulated genes; gray, down-regulated genes). (B) Biological processes altered in IL22 plants relative to OLESA plants. GO terms enriched in up- and down-regulated genes in IL22 plants were visualized by REVIGO (Supek et al., 2011). The most enriched GO terms in the set of up-regulated and down-regulated genes are presented (upper and lower panels, respectively). Circles represent GO terms and those clustered closer to each other indicate similar GO terms. Color scale (yellow to red) represents the degree of GO enrichment (log10 P-value). Larger and smaller disc size represent more general and more specific terms, respectively.
