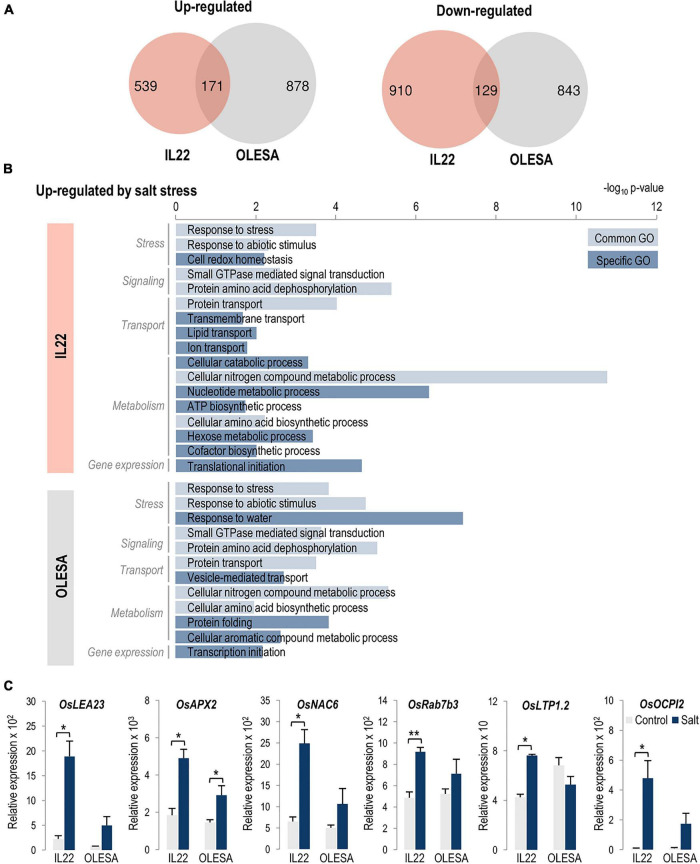
FIGURE 7.
Comparison of OLESA and IL22 transcriptomes in response to salt stress (80 mM NaCl, 24 h of treatment). (A) Venn diagrams indicate the number of genes that are specifically and commonly regulated by salt stress in each genotype, up-regulated and down-regulated genes (log2 fold change >0.5 or <–0.5; P-value ≤ 0.05). (B) Enriched GO terms in biological processes in the up-regulated genes in each genotype performed using AgriGO (Tian et al., 2017). Light and dark blue bars indicate common and genotype-specific GO terms, respectively. The scale shows the statistical significance (–log10 P-value). (C) Salt-responsiveness of genes identified in japonica regions of IL22 and OLESA. Plants were grown in hydroponic cultures under control and salt-conditions (24 h of salt treatment, 80 mM NaCl). Transcript levels of the indicated genes were determined by RT-qPCR. OsUbi1 was used as the reference gene. Bars represent means of three biological replicates, each one from a pool of four different plants, ±SEM (Student’s t-test, *P ≤ 0.05, **P ≤ 0.005). OsLEA23 (Late Embryogenesis Abundant protein 23), OsAPX2 (Ascorbate peroxidase 2), OsNAC6 (NAM/ATAF/CUC 6 TF), OsRab7b3 (Ras-related in brain 7 B3); OsLTP1.2 (Lipid transfer protein 1.2), and OsOCPI2 (Oryza sativa chymotrypsin inhibitor-like 2). Primers and locus ID are listed in Supplementary Table 2.

