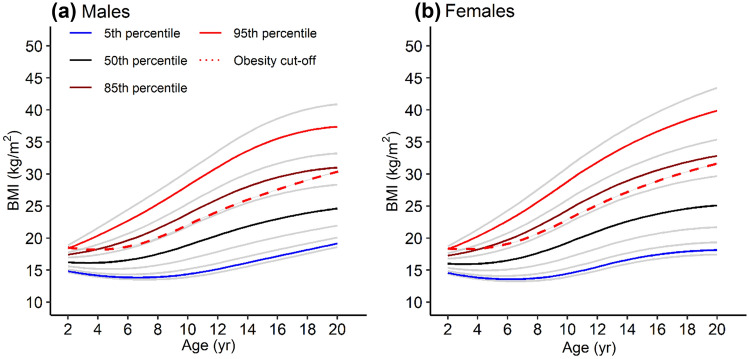
Fig. 1.
Updated growth curves based on National Health and Nutrition Examination Survey (NHANES) pooled data for male and female groups. Key body mass index (BMI) percentiles are highlighted in blue (5th percentile), black (50th percentile), dark red (85th percentile), and red (95th percentile). The BMI cut-off for obesity as defined by the Centers for Disease Control and Prevention (CDC) is represented by the bold red dashed line, such that children with a BMI above that line for a given age are considered obese. Files with lambda-mu-sigma (LMS) parameters for plotting the updated growth curves and calculating updated BMI percentiles are provided in the ESM

