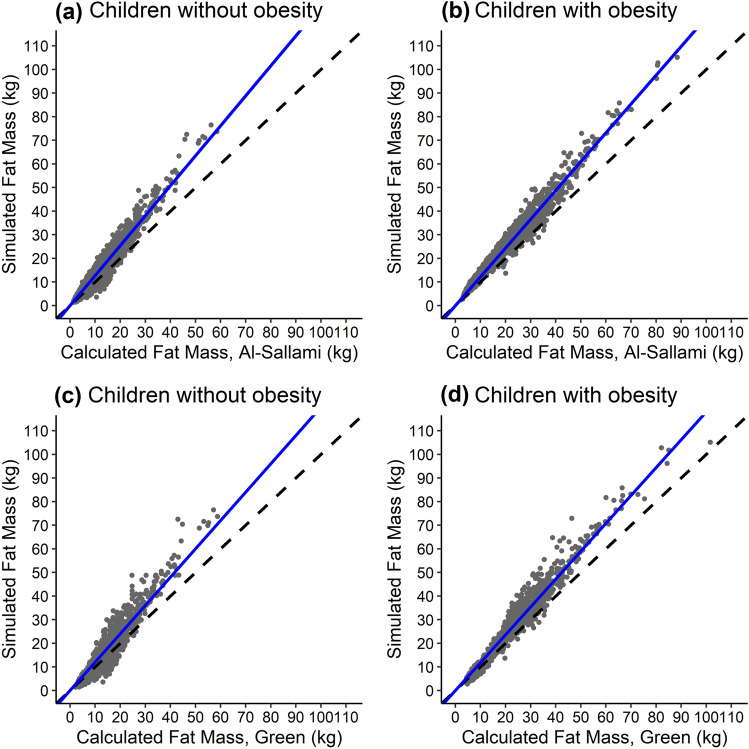
Fig. 2.
Simulated vs calculated fat mass for 1500 virtual children without (a and c) and 1500 virtual children with (b and d) obesity. Simulated fat mass was determined from the volume of the adipose organ generated for each virtual child in PK-Sim®. Calculated fat mass was determined using each virtual child’s demographic information and the fat mass equations derived from Al-Sallami et al. (a and b) and Green et al. (c and d) [33, 34]. Each point represents a single virtual child. Dashed lines represent the lines of unity for reference, and blue lines represent a linear regression passing through the origin for better visualization of misspecification. The slope of this regression line is 1.26, 1.22, 1.20, and 1.18 for (a–d), respectively

