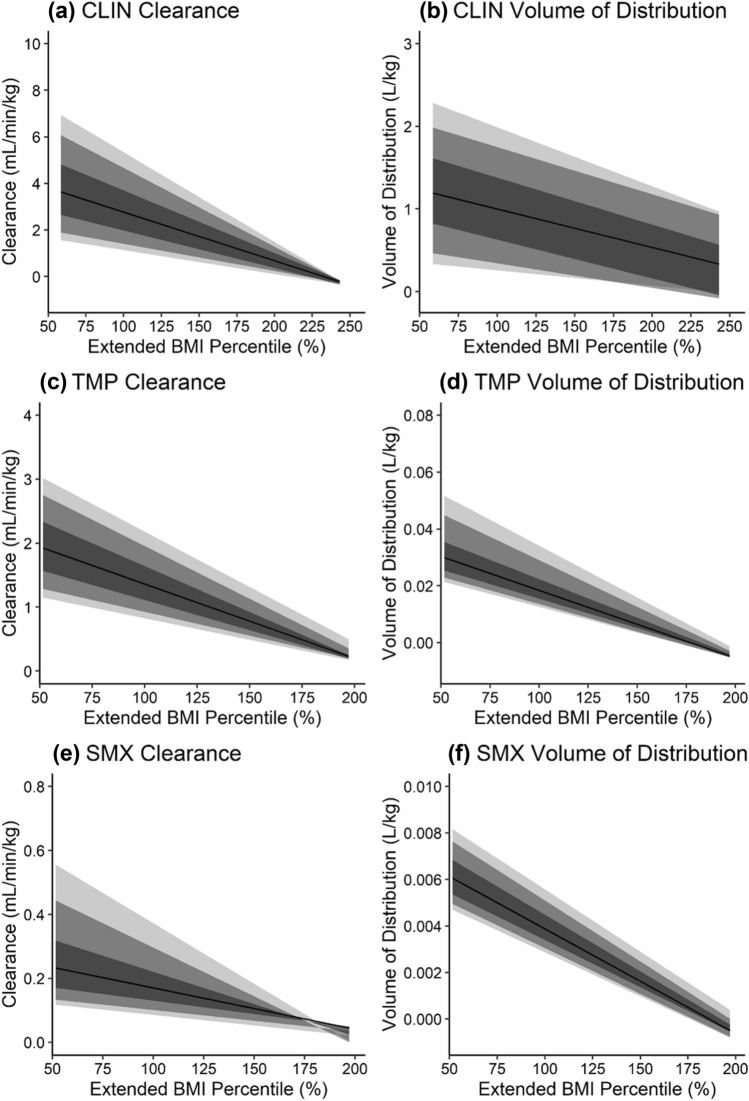
Fig. 3.
Changes in simulated weight-normalized clearance (a, c, e) and weight-normalized volume of distribution (b, d, f) for clindamycin (a, b), trimethoprim (c, d), and sulfamethoxazole (e, f) with increasing body size, i.e., extended body mass index (BMI) percentile. Extended BMI percentile is calculated as BMI divided by the 95th BMI percentile for a subject’s age and sex, where children with an extended BMI percentile ≥ 100% are considered obese. Clearance and volume of distribution were calculated from virtual children aged 12–18 years with and without obesity (similar plots for virtual children aged 2–6 years and 6–12 years are presented in Figs. 14 and 15 of the ESM). Virtual children received single doses of 600 mg intravenous (IV) infusion (30 min) clindamycin (CLIN), 160 mg oral (PO) trimethoprim (TMP), and 800 mg PO sulfamethoxazole (SMX). The shaded regions denote the 90% (95th and 5th percentiles), 80% (90th and 10th percentiles), and 50% (75th and 25th percentiles) prediction intervals from lightest to darkest color intensity, respectively. The black line denotes the median prediction. Note that variability in pharmacokinetic parameters appears decreased at the upper extremity of extended BMI percentile owing to a lower number of virtual subjects in this range

