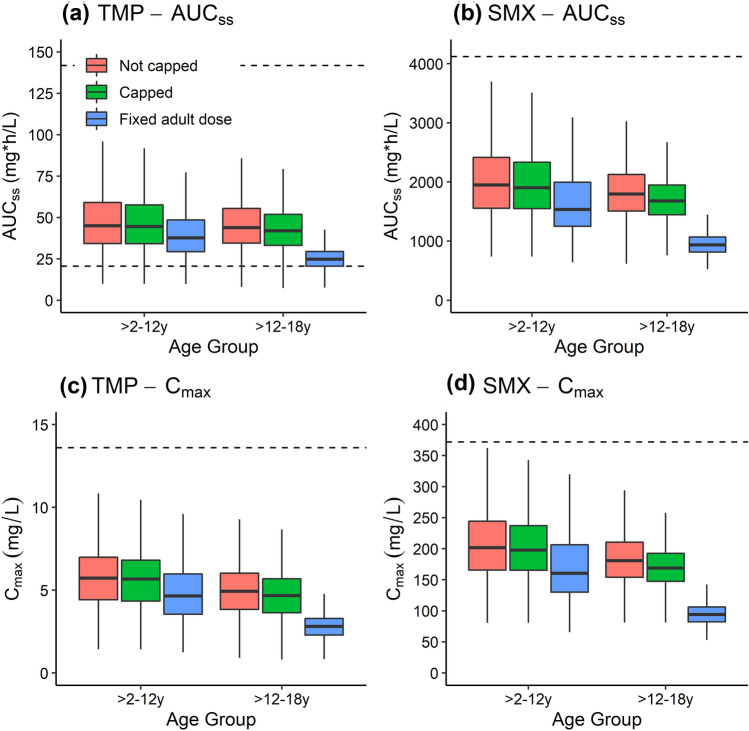
Fig. 5.
Boxplots of simulated trimethoprim (TMP) and sulfamethoxazole (SMX) steady-state area under the concentration–time curve (AUCss) and maximum concentration (Cmax) in virtual children with obesity following population simulations (n = 1000 per age group). Virtual children received either the total weight-based recommended dose (6 and 30 mg/kg orally [PO] for children aged > 2–12 years and 4 and 20 mg/kg PO for children aged > 12–18 years) or the recommended dosing with a cap of 320 and 1600 mg PO, as per the US Food and Drug Administration (FDA) maximum recommended dose, or a fixed adult dose of 160 and 800 mg PO for TMP and SMX, respectively. Boxes represent the median and interquartile range (IQR), and whiskers extend to 1.5*IQR. The solid line represents the target AUCss efficacy threshold for TMP, and the dashed lines represent the toxicity AUCss and Cmax thresholds for both TMP and SMX

