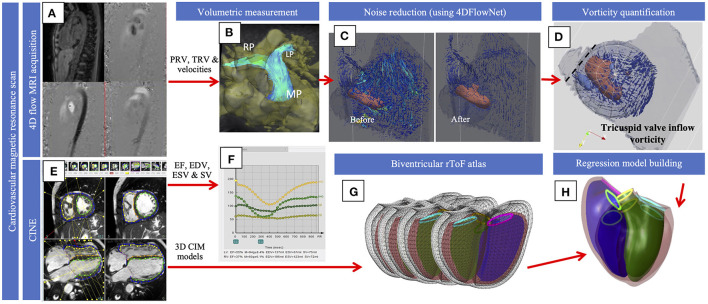
Figure 1.
Diagrammatic representation of the methodology. 4D flow (A) was used for volumetric quantification of flow in the pulmonary and across the tricuspid valve (B) and velocity data was processed with the 4D flow neural network (C). Vorticity (D) was quantified and visualized with the vortex core and streamlines that demonstrate velocity within the spherical ROI was shown, and the dotted line represents the opening of the tricuspid valve. Cines (E) were used to extract EDV, ESV and SV (F). Cines were also used to build the models for the current population that were projected onto the atlas (G). Regression models (H) were used to compute shape variations associated with vorticity. The figure shows an overlapping of the diagrams of a normal biventricular model and the model generated to show the effect of vorticity.

