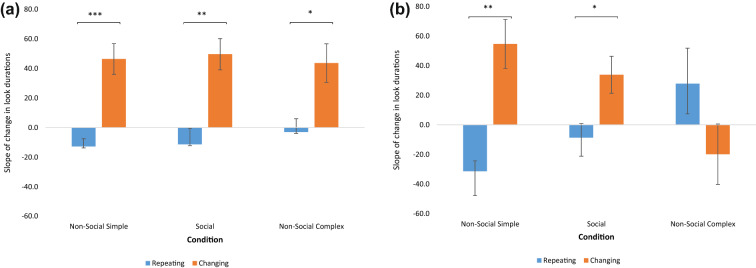
Fig. 2.
a The main effect of stimulus in neurotypical participants. Bars show the mean (±1 standard error) coefficient of the slope for the rate of change in look durations over trials (plotted on the y-axis). These data are split by stimulus type and condition. Asterisks denote statistical significance: *p < 0.05, **p < 0.01, ***p < 0.001. The interaction between Condition. *Stimulus is non-significant but shown here for the purpose of visualization of differences from the Autism-only group shown in Fig. 2b. b Condition*Stimulus interaction in the autism-only group. Bars show the mean (±1 standard error) coefficient of the slope for the rate of change in look durations over trials (plotted on the y-axis). These data are split by stimulus type and condition. Asterisks denote statistical significance: *p < 0.05, **p < 0.01, ***p < 0.001

